

Question
You have submitted your initial analysis to the sales team at D.M. Pan Real Estate Company. You will continue your analysis of the provided Real
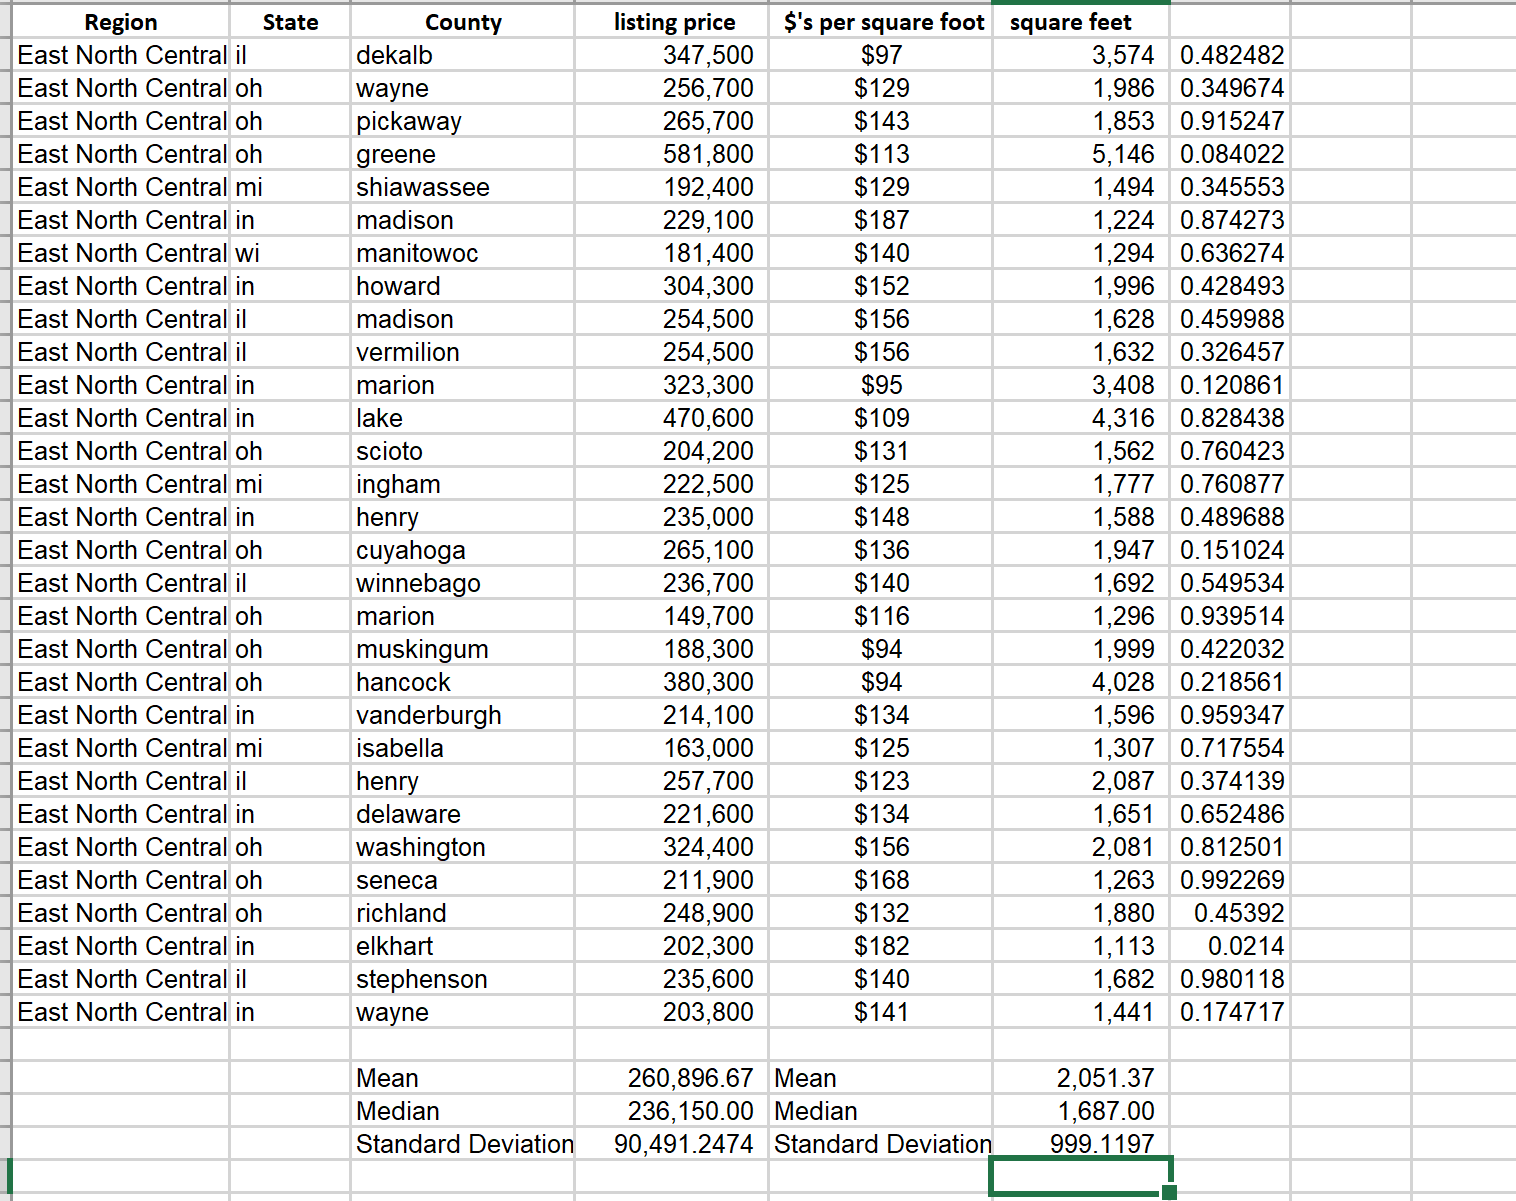
You have submitted your initial analysis to the sales team at D.M. Pan Real Estate Company. You will continue your analysis of the provided Real Estate Data spreadsheet using your selected region to complete your analysis. You may refer back to the initial report you developed in the Module Two Assignment Template to continue the work. This document and the National Statistics and Graphs spreadsheet will support your work on the assignment.
Note: In the report you prepare for the sales team, the dependent, or response, variable (y) should be the listing price and the independent, or predictor, variable (x) should be the square feet.
Using the Module Three Assignment Template, specifically address the following:
- Regression Equation: Provide the regression equation for the line of best fit using the scatterplot from the Module Two assignment.
- Determine r: Determine r and what it means. (What is the relationship between the variables?)
- Determine the strength of the correlation (weak, moderate, or strong).
- Discuss how you determine the direction of the association between the two variables.
- Is there a positive or negative association?
- What do you see as the direction of the correlation?
- Examine the Slope and Intercepts: Examine the slopeb1{"version":"1.1","math":""} and intercept b0{"version":"1.1","math":""}.
- Draw conclusions from the slope and intercept in the context of this problem.
- Does the intercept make sense based on your observation of the line of best fit?
- Determine the value of the land only. Note: You can assume, when the square footage of the house is zero, that the price is the value of just the land. This happens when x=0, which is the y-intercept. Does this value make sense in context?
- Draw conclusions from the slope and intercept in the context of this problem.
- Determine the R-squared Coefficient: Determine the R-squared value.
- Discuss what R-squared means in the context of this analysis.
- Conclusions: Reflect on the Relationship: Reflect on the relationship between square feet and sales price by answering the following questions:
- Is the square footage for homes in your selected region different than for homes overall in the United States?
- For every 100 square feet, how much does the price go up (i.e., can you use slope to help identify price changes)?
- What square footage range would the graph be best used for?
Step by Step Solution
There are 3 Steps involved in it
Step: 1

Get Instant Access to Expert-Tailored Solutions
See step-by-step solutions with expert insights and AI powered tools for academic success
Step: 2

Step: 3
Ace Your Homework with AI
Get the answers you need in no time with our AI-driven, step-by-step assistance
Get Started
Intermediate Algebra A Text/Workbook
Authors: Charles P McKeague
2nd Edition
1483214176, 9781483214177