Answered step by step
Verified Expert Solution
Question
1 Approved Answer
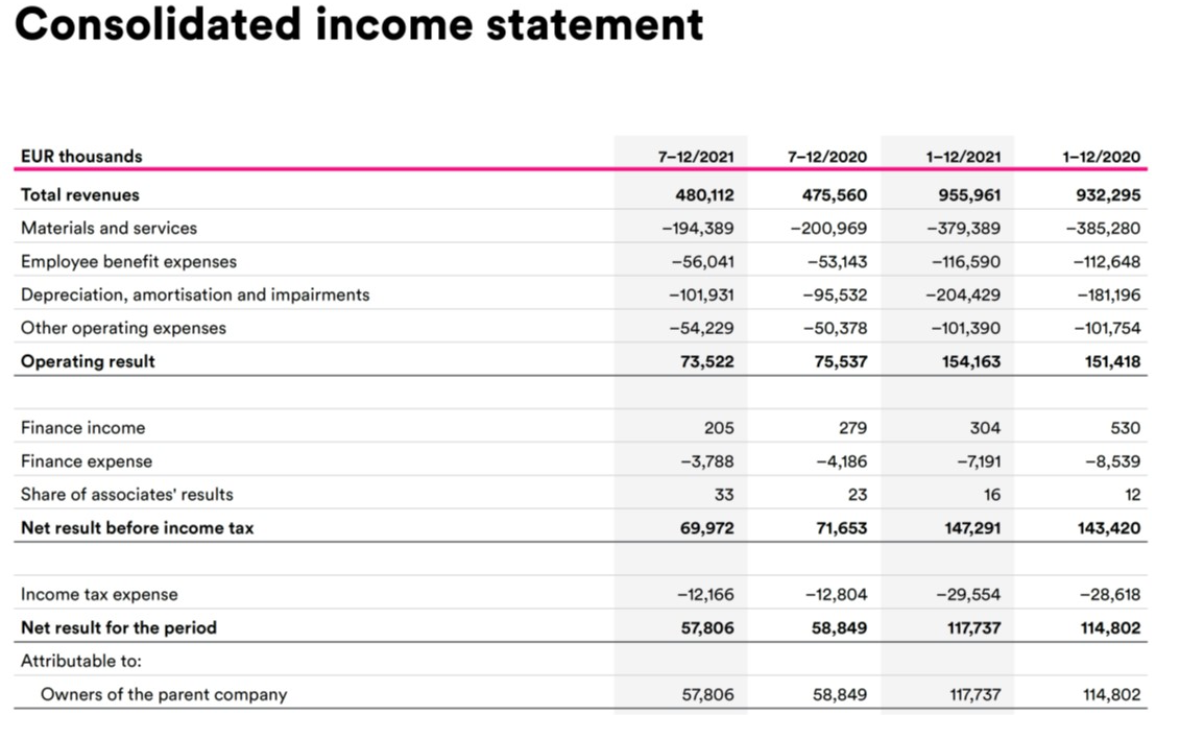
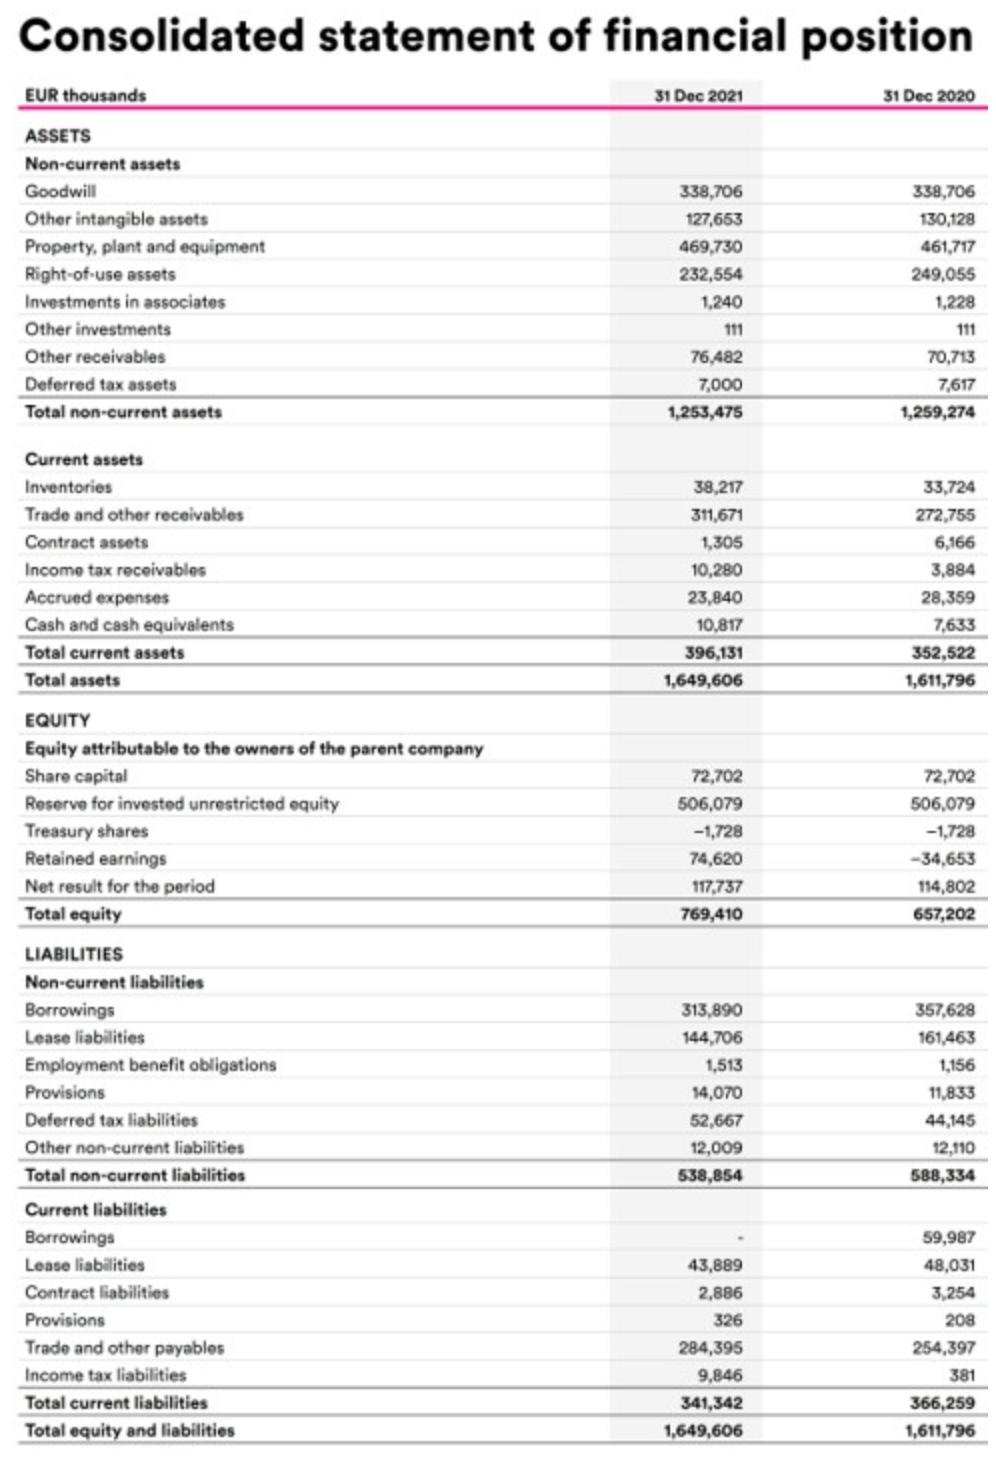
You have the following financial information on DNA, a Finnish telecom firm. Based on comparable companies, you have determined the appropriate EV/EBITDA 2021 multiple for
You have the following financial information on DNA, a Finnish telecom firm. Based on comparable companies, you have determined the appropriate EV/EBITDA 2021 multiple for the business to be 8.0x. What is the corresponding equity value for DNA? Please answer in EUR million, with one decimal.
Income statement:

Balance sheet:

Consolidated income statement EUR thousands 7-12/2021 7-12/2020 1-12/2021 1-12/2020 480,112 955,961 932,295 475,560 -200,969 -194,389 -379,389 -385,280 -56,041 -116,590 -112,648 Total revenues Materials and services Employee benefit expenses Depreciation, amortisation and impairments Other operating expenses Operating result -53,143 -95,532 -50,378 -101,931 -54,229 -181,196 -204,429 -101,390 -101,754 73,522 75,537 154,163 151,418 Finance income 205 279 304 530 -3,788 -4,186 -7,191 -8,539 Finance expense Share of associates' results 33 23 16 12 Net result before income tax 69,972 71,653 147,291 143,420 -12,166 -12,804 -28,618 Income tax expense Net result for the period Attributable to: -29,554 117,737 57,806 58,849 114,802 Owners of the parent company 57,806 58,849 117,737 114,802 Consolidated statement of financial position EUR thousands 31 Dec 2021 31 Dec 2020 ASSETS Non-current assets Goodwill 338,706 338,706 Other intangible assets 127,653 130,128 Property, plant and equipment 469,730 461,717 Right-of-use assets 232,554 249,055 Investments in associates 1.240 1.228 Other investments 111 Other receivables 76.482 70,713 Deferred tax assets 7,000 7,617 Total non-current assets 1,253,475 1,259,274 111 38,217 311,671 1,305 10,280 23,840 10.817 396,131 1,649,606 33,724 272,755 6,166 3,884 28,359 7,633 352,522 1,611,796 72,702 506,079 -1,728 74,620 117,737 769,410 72,702 506,079 -1,728 -34,653 114,802 657,202 Current assets Inventories Trade and other receivables Contract assets Income tax receivables Accrued expenses Cash and cash equivalents Total current assets Total assets EQUITY Equity attributable to the owners of the parent company Share capital Reserve for invested unrestricted equity Treasury shares Retained earnings Net result for the period Total equity LIABILITIES Non-current liabilities Borrowings Lease liabilities Employment benefit obligations Provisions Deferred tax liabilities Other non-current liabilities Total non-current liabilities Current liabilities Borrowings Lease liabilities Contract liabilities Provisions Trade and other payables Income tax liabilities Total current liabilities Total equity and liabilities 313,890 144,706 1,513 14.070 52,667 12,009 538,854 357,628 161,463 1,156 11,833 44,145 12,110 588,334 43,889 2,886 326 284,395 9,846 341,342 1,649,606 59,987 48,031 3,254 208 254,397 381 366,259 1,611,796 Consolidated income statement EUR thousands 7-12/2021 7-12/2020 1-12/2021 1-12/2020 480,112 955,961 932,295 475,560 -200,969 -194,389 -379,389 -385,280 -56,041 -116,590 -112,648 Total revenues Materials and services Employee benefit expenses Depreciation, amortisation and impairments Other operating expenses Operating result -53,143 -95,532 -50,378 -101,931 -54,229 -181,196 -204,429 -101,390 -101,754 73,522 75,537 154,163 151,418 Finance income 205 279 304 530 -3,788 -4,186 -7,191 -8,539 Finance expense Share of associates' results 33 23 16 12 Net result before income tax 69,972 71,653 147,291 143,420 -12,166 -12,804 -28,618 Income tax expense Net result for the period Attributable to: -29,554 117,737 57,806 58,849 114,802 Owners of the parent company 57,806 58,849 117,737 114,802 Consolidated statement of financial position EUR thousands 31 Dec 2021 31 Dec 2020 ASSETS Non-current assets Goodwill 338,706 338,706 Other intangible assets 127,653 130,128 Property, plant and equipment 469,730 461,717 Right-of-use assets 232,554 249,055 Investments in associates 1.240 1.228 Other investments 111 Other receivables 76.482 70,713 Deferred tax assets 7,000 7,617 Total non-current assets 1,253,475 1,259,274 111 38,217 311,671 1,305 10,280 23,840 10.817 396,131 1,649,606 33,724 272,755 6,166 3,884 28,359 7,633 352,522 1,611,796 72,702 506,079 -1,728 74,620 117,737 769,410 72,702 506,079 -1,728 -34,653 114,802 657,202 Current assets Inventories Trade and other receivables Contract assets Income tax receivables Accrued expenses Cash and cash equivalents Total current assets Total assets EQUITY Equity attributable to the owners of the parent company Share capital Reserve for invested unrestricted equity Treasury shares Retained earnings Net result for the period Total equity LIABILITIES Non-current liabilities Borrowings Lease liabilities Employment benefit obligations Provisions Deferred tax liabilities Other non-current liabilities Total non-current liabilities Current liabilities Borrowings Lease liabilities Contract liabilities Provisions Trade and other payables Income tax liabilities Total current liabilities Total equity and liabilities 313,890 144,706 1,513 14.070 52,667 12,009 538,854 357,628 161,463 1,156 11,833 44,145 12,110 588,334 43,889 2,886 326 284,395 9,846 341,342 1,649,606 59,987 48,031 3,254 208 254,397 381 366,259 1,611,796
Step by Step Solution
There are 3 Steps involved in it
Step: 1

Get Instant Access to Expert-Tailored Solutions
See step-by-step solutions with expert insights and AI powered tools for academic success
Step: 2

Step: 3

Ace Your Homework with AI
Get the answers you need in no time with our AI-driven, step-by-step assistance
Get Started


