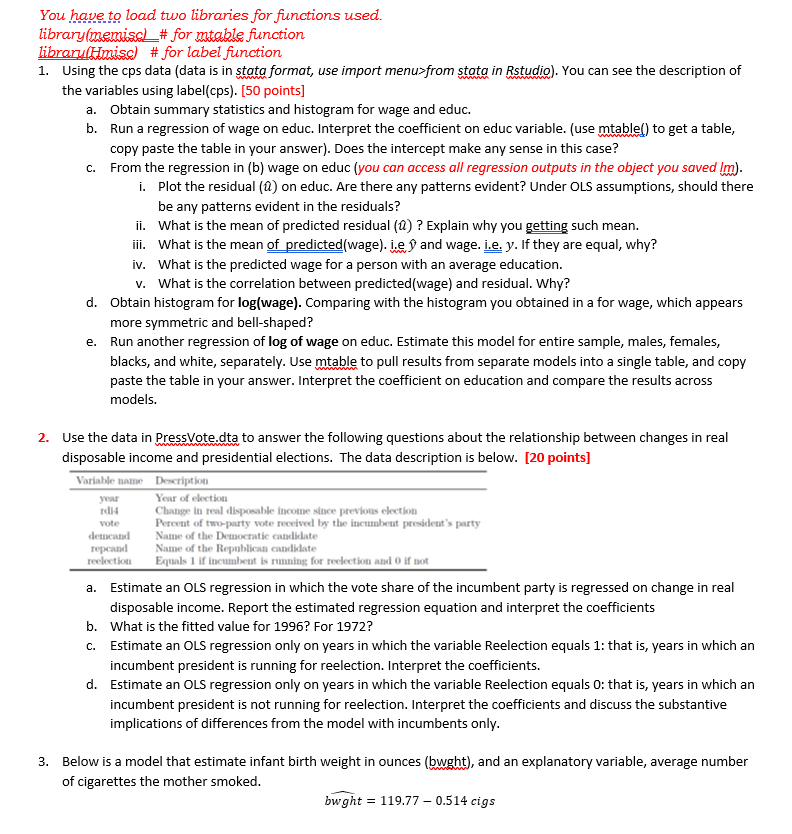
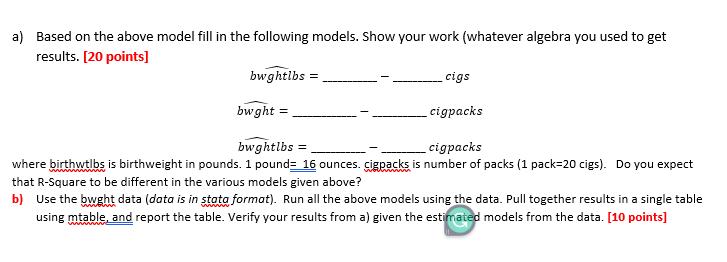
You have to load two libraries for functions used. library(memisc) # for mable function libraru(Homisc) # for label function 1. Using the cps data (data is in stata format, use import menu>from stata in Rstudio). You can see the description of the variables using label(cps). [50 points] a. Obtain summary statistics and histogram for wage and educ. b. Run a regression of wage on educ. Interpret the coefficient on educ variable. (use mtable() to get a table, copy paste the table in your answer). Does the intercept make any sense in this case? c. From the regression in (b) wage on educ (you can access all regression outputs in the object you saved 1m ). i. Plot the residual (^) on educ. Are there any patterns evident? Under OLS assumptions, should there be any patterns evident in the residuals? ii. What is the mean of predicted residual (a^) ? Explain why you getting such mean. iii. What is the mean of predicted(wage). i.e y^ and wage. i.e. y. If they are equal, why? iv. What is the predicted wage for a person with an average education. v. What is the correlation between predicted(wage) and residual. Why? d. Obtain histogram for log(wage). Comparing with the histogram you obtained in a for wage, which appears more symmetric and bell-shaped? e. Run another regression of log of wage on educ. Estimate this model for entire sample, males, females, blacks, and white, separately. Use mtable to pull results from separate models into a single table, and copy paste the table in your answer. Interpret the coefficient on education and compare the results across models. 2. Use the data in Presote.dta to answer the following questions about the relationship between changes in real disposable income and presidential elections. The data description is below. [20 points] a. Estimate an OLS regression in which the vote share of the incumbent party is regressed on change in real disposable income. Report the estimated regression equation and interpret the coefficients b. What is the fitted value for 1996 ? For 1972 ? c. Estimate an OLS regression only on years in which the variable Reelection equals 1: that is, years in which an incumbent president is running for reelection. Interpret the coefficients. d. Estimate an OLS regression only on years in which the variable Reelection equals 0 : that is, years in which an incumbent president is not running for reelection. Interpret the coefficients and discuss the substantive implications of differences from the model with incumbents only. 3. Below is a model that estimate infant birth weight in ounces (bwght), and an explanatory variable, average number of cigarettes the mother smoked. bwght=119.770.514cigs a) Based on the above model fill in the following models. Show your work (whatever algebra you used to get results. [20 points] bwghtlbs= cigs bwght= cigpacks cigpacks where birthwtlbs is birthweight in pounds. 1 pound= 16 ounces. cigpacks is number of packs ( 1 pack=20 cigs). Do you expect that R-Square to be different in the various models given above? b) Use the bwght data (data is in stata format). Run all the above models using the data. Pull together results in a single table using mtable, and report the table. Verify your results from a) given the estimated models from the data. [10 points] You have to load two libraries for functions used. library(memisc) # for mable function libraru(Homisc) # for label function 1. Using the cps data (data is in stata format, use import menu>from stata in Rstudio). You can see the description of the variables using label(cps). [50 points] a. Obtain summary statistics and histogram for wage and educ. b. Run a regression of wage on educ. Interpret the coefficient on educ variable. (use mtable() to get a table, copy paste the table in your answer). Does the intercept make any sense in this case? c. From the regression in (b) wage on educ (you can access all regression outputs in the object you saved 1m ). i. Plot the residual (^) on educ. Are there any patterns evident? Under OLS assumptions, should there be any patterns evident in the residuals? ii. What is the mean of predicted residual (a^) ? Explain why you getting such mean. iii. What is the mean of predicted(wage). i.e y^ and wage. i.e. y. If they are equal, why? iv. What is the predicted wage for a person with an average education. v. What is the correlation between predicted(wage) and residual. Why? d. Obtain histogram for log(wage). Comparing with the histogram you obtained in a for wage, which appears more symmetric and bell-shaped? e. Run another regression of log of wage on educ. Estimate this model for entire sample, males, females, blacks, and white, separately. Use mtable to pull results from separate models into a single table, and copy paste the table in your answer. Interpret the coefficient on education and compare the results across models. 2. Use the data in Presote.dta to answer the following questions about the relationship between changes in real disposable income and presidential elections. The data description is below. [20 points] a. Estimate an OLS regression in which the vote share of the incumbent party is regressed on change in real disposable income. Report the estimated regression equation and interpret the coefficients b. What is the fitted value for 1996 ? For 1972 ? c. Estimate an OLS regression only on years in which the variable Reelection equals 1: that is, years in which an incumbent president is running for reelection. Interpret the coefficients. d. Estimate an OLS regression only on years in which the variable Reelection equals 0 : that is, years in which an incumbent president is not running for reelection. Interpret the coefficients and discuss the substantive implications of differences from the model with incumbents only. 3. Below is a model that estimate infant birth weight in ounces (bwght), and an explanatory variable, average number of cigarettes the mother smoked. bwght=119.770.514cigs a) Based on the above model fill in the following models. Show your work (whatever algebra you used to get results. [20 points] bwghtlbs= cigs bwght= cigpacks cigpacks where birthwtlbs is birthweight in pounds. 1 pound= 16 ounces. cigpacks is number of packs ( 1 pack=20 cigs). Do you expect that R-Square to be different in the various models given above? b) Use the bwght data (data is in stata format). Run all the above models using the data. Pull together results in a single table using mtable, and report the table. Verify your results from a) given the estimated models from the data. [10 points]