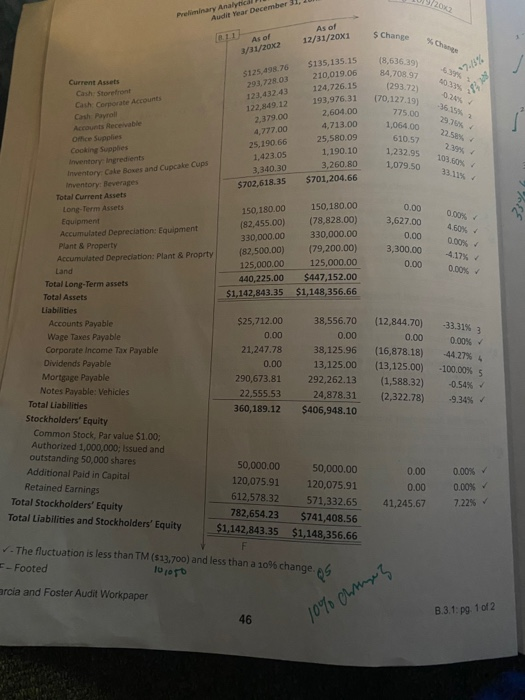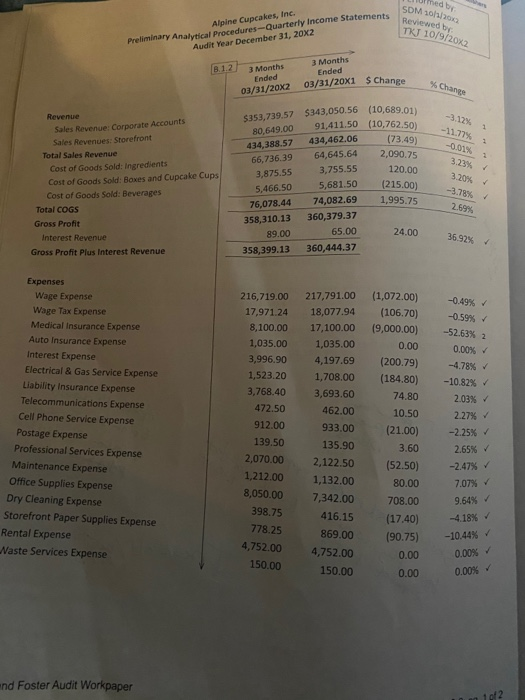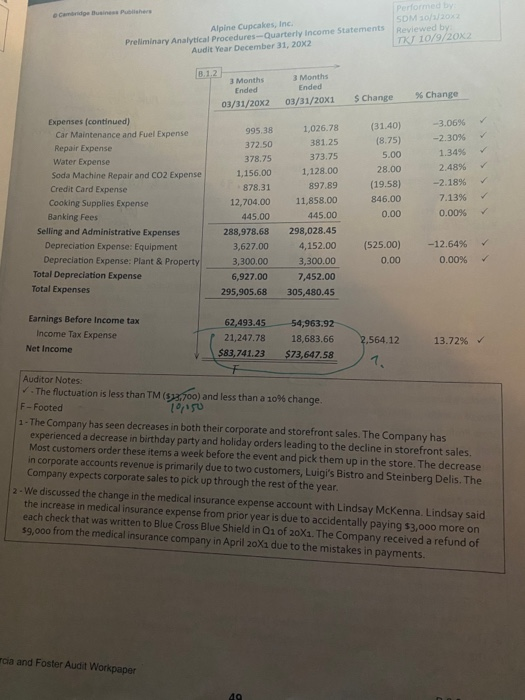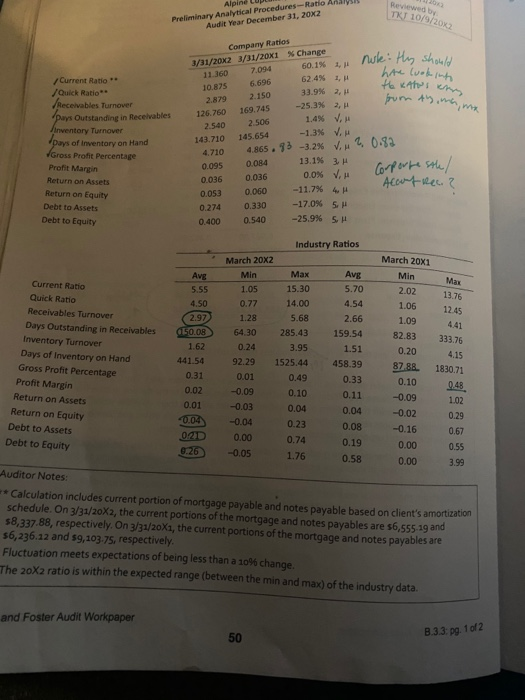
you identify. 26. Prepare a memo to document your understanding of Alpine Cupcakes environment and provide your assessment of Garcia and Foster's audit risk. Describe the specific risks for Alpine Cupcakes, explain why you believe these factors relate to the Alpine Cupcakes audit, and identify which specific accounts are likely to be affected by these risks. Describe how the audit teams should address the risks identified. For example, the background information mentions that sugar prices may rise. What risks would this present to Alpine Cupcakes? Which accounts would be affected by this risk? How should the audit team address these risks in the audit plan? 120% Preliminary Analyti Audit Mar December 31, As of 12/31/20x1 $ Change As of 3/31/2002 *7.15% Current Assets Cash Storefront Cash Corporate Accounts $125,49876 293,72R03 123.432.43 122,849.12 2,379.00 4,277.00 25.190.66 1,423.05 3,340.30 $702,618.35 $135,135.15 210.019.06 124,726.15 193,976,31 2,604.00 4,713.00 25,580.09 1,190.10 3,260.80 $701,204.66 (8,636.39) 84,708 97 (293.72) (70,127.19 775.00 1,06400 610.52 1,232.95 1,079.50 22.5% 103.60% 33.11% Office Supplies Cooking Supplies Inventory Ingredients Inventory Cole Boxes and Cupcake Cups Inventory: Beverages Total Current Assets Long-Term Assets Equipment Accumulated Depreciation: Equipment Plant & Property Accumulated Depreciation: Plant & Proprty Land Total Long-Term assets Total Assets 150,180.00 150,180.00 (82,455.00) (78,828.00) 330,000.00 330,000.00 (82,500.00) 179,200.00) 125,000.00 125,000.00 440,225.00 $447,152.00 $1,142,843.35 $1,148,356.66 0.00 3,627.00 0.00 3,300.00 0.00 0.00% 4.60% 0.00% 4.17% 0.00% -33.315 3 0.00% (12,844.70) 0.00 (16,878.18) (13,125.00) (1,588.32) (2,322.78) -44.27% 4 -100.00% 5 -0.54% -9.34% Liabilities $25,712.00 38,556.70 Accounts Payable 0.00 0.00 Wage Taxes Payable 21, 247.78 38,125.96 Corporate Income Tax Payable 0.00 13,125.00 Dividends Payable Mortgage Payable 290,673.81 292,262.13 Notes Payable: Vehicles 22,555.53 24,878.31 Total Liabilities 360,189.12 $406,948.10 Stockholders' Equity Common Stock, Par value $1.00; Authorized 1,000,000; Issued and outstanding 50,000 shares 50,000.00 50,000.00 Additional Paid in Capital 120,075.91 120,075.91 Retained Earnings 612,578.32 571,332.65 Total Stockholders' Equity 782,654.23 $741,408.56 Total Liabilities and Stockholders' Equity $1,142,843.35 $1,148,356.66 F -The fluctuation is less than TM (523,700) and less than a 10% change. - Footed 1000 arcia and Foster Audit Workpaper 46 0.00 0.00 41,245.67 0.00% 0.00% 7.225 Pos 10% Charge} B.3.1: Pg 1012 by SOM 101/2003 Reviewed by TKJ 10/9/20X2 Alpine Cupcakes, Inc. Preliminary Analytical Procedures-Quarterly Income Statements Audit Year December 31, 20x2 /8.1.2 3 Months Ended 03/31/20X2 3 Months Ended 03/31/20x1 S Change % Change 1 1 Revenue Sales Revenue: Corporate Accounts Sales Revenues Storefront Total Sales Revenue Cost of Goods Sold: Ingredients Cost of Goods Sold: Boxes and Cupcake Cups Cost of Goods Sold: Beverages Total COGS Gross Profit Interest Revenue Gross Profit Plus Interest Revenue $353,739.57 $343,050.56 (10,689.01) 80,649.00 91,411.50 (10,762.50) 434,388.57 434,462.06 66,736.39 64,645.64 3,875.55 3,755.55 5,466.50 5,681.50 76,078,44 74,082.69 358,310.13 360,379.37 89.00 65.00 358,399.13 360,444.37 (73.49) 2,090.75 120.00 (215.00) 1,995.75 -3.12% -11.77% -0.01% 3.23% 3.20% -3.78% 2.69% 24.00 36.92% -0.49% -0.59% -52.63% 2 0.00% -4.78% Expenses Wage Expense Wage Tax Expense Medical Insurance Expense Auto Insurance Expense Interest Expense Electrical & Gas Service Expense Liability Insurance Expense Telecommunications Expense Cell Phone Service Expense Postage Expense Professional Services Expense Maintenance Expense Office Supplies Expense Dry Cleaning Expense Storefront Paper Supplies Expense Rental Expense Naste Services Expense 216,719.00 17,971.24 8,100.00 1,035.00 3,996.90 1,523.20 3,768.40 472.50 912.00 139.50 2,070.00 1,212.00 8,050.00 398.75 778.25 4,752.00 217,791.00 18,077.94 17,100.00 1,035.00 4,197.69 1,708.00 3,693.60 462.00 933.00 135.90 2,122.50 1,132.00 7,342.00 416.15 869.00 4,752.00 150.00 (1,072.00) (106.70) 19,000.00) 0.00 (200.79) (184.80) 74.80 10.50 (21.00) 3.60 (52.50) 80.00 708.00 (17.40) (90.75) 0.00 0.00 -10.82% 2.03% 2.27% -2.25% 2.65% -2.47% 7.07% 9.64% -4.18% -10.44% 0.00% 0.00% 150.00 und Foster Audit Workpaper Cambridge Business Publishers Performed by SOM 10/1/20 Reviewed by IKT 10/9/20X2 Alpine Cupcakes, Inc. Preliminary Analytical Procedures - Quarterly Income Statements Audit Year December 31, 20X2 18.1.2 3 Months Ended 03/31/20X2 3 Months Ended 03/31/20x1 $ Change % Change Expenses (continued) Car Maintenance and Fuel Expense Repair Expense Water Expense Soda Machine Repair and CO2 Expense Credit Card Expense Cooking Supplies Expense Banking Fees Selling and Administrative Expenses Depreciation Expense: Equipment Depreciation Expense: Plant & Property Total Depreciation Expense Total Expenses 995.38 372.50 378.75 1,156.00 878.31 12,704.00 445.00 288,978.68 3,627.00 3,300.00 6,927.00 295,905.68 1,026.78 381.25 373.75 1,128.00 897.89 11,858.00 445.00 (31.40) (8.75) 5.00 28.00 (19.58) 846.00 0.00 -3.06% -2.30% 1.34% 2.48% -2.1896 7.1396 0.00% 298,028.45 4,152.00 3,300.00 7,452.00 305,480.45 (525.00) 0.00 -12.64% 0.00% Earnings Before Income tax Income Tax Expense Net Income 62,493.45 21,247.78 $83,741.23 54,963.92 18,683.66 $73,647.58 2.564.12 13.72% 7. Auditor Notes The fluctuation is less than TM ($2.700) and less than a 10% change. F-Footed 19,050 1 - The Company has seen decreases in both their corporate and storefront sales. The Company has experienced a decrease in birthday party and holiday orders leading to the decline in storefront sales. Most customers order these items a week before the event and pick them up in the store. The decrease in corporate accounts revenue is primarily due to two customers, Luigi's Bistro and Steinberg Delis. The Company expects corporate sales to pick up through the rest of the year. 2. We discussed the change in the medical insurance expense account with Lindsay McKenna. Lindsay said the increase in medical insurance expense from prior year is due to accidentally paying $3,000 more on each check that was written to Blue Cross Blue Shield in Q1 of 20X1. The Company received a refund of 39,000 from the medical insurance company in April 20X due to the mistakes in payments. Tcia and Foster Audit Workpaper 49 Alpine Reviewed by TK 10/9/2012 Preliminary Analytical Procedures-Ratio Anal Audit Year December 31, 20X2 nuk: thy should hare looking the Katos kry from As, ma, ma Company Ratios 3/31/20X2 3/31/20x1 % Change 7.094 60.1% 1, 11 360 10.875 6.696 62.4% 1, 2.879 2.150 33.9% 2, 126.760 169.745 -25.3% 2, 2.540 2.506 1.4% V. 143.710 145.654 -1.3% V. 4.710 4.865.43 -3.2% VH 0.095 0.084 0.036 0.036 0.053 0.060 0.274 0.330 0.400 0.540 Current Ratio Quick Ratio Receivables Turnover Pays Outstanding in Receivables inventory Turnover pays of Inventory on Hand Gross Profit Percentage Profit Margin Return on Assets Return on Equity Debt to Assets Debt to Equity 2 0.82 Comportestle/ 13.1% 3 0.0% V. -11.7% 9H -17.0% 5. -25.9% 5. Account Rec? March 20x1 Avg 5.55 4.50 2.97 (150.08 1.62 Max 13.76 12.45 Current Ratio Quick Ratio Receivables Turnover Days Outstanding in Receivables Inventory Turnover Days of Inventory on Hand Gross Profit Percentage Profit Margin Return on Assets Return on Equity Debt to Assets Debt to Equity Industry Ratios March 20X2 Min Max Avg 1.05 15.30 5.70 0.77 14.00 4.54 1.28 5.68 2.66 64.30 285.43 159.54 0.24 3.95 1.51 92.29 1525.44 458.39 0.01 0.49 0.33 -0.09 0.10 0.11 -0.03 0.04 0.04 -0.04 0.23 0.08 0.00 0.74 0.19 -0.05 1.76 0.58 Min 2.02 1.06 1.09 82.83 0.20 87.88 0.10 -0.09 -0.02 -0.16 441 54 333.76 4.15 1830.71 0.48 1.02 0.31 0.02 0.01 -0.04 021 9.26 0.29 0.67 0.55 3.99 0.00 0.00 Auditor Notes Calculation includes current portion of mortgage payable and notes payable based on client's amortization schedule. On 3/31/20X2, the current portions of the mortgage and notes payables are 56,555.19 and $8,337.88, respectively. On 3/31/20X2, the current portions of the mortgage and notes payables are $6,236.12 and 59,103-75, respectively. Fluctuation meets expectations of being less than a 10% change. The 20X2 ratio is within the expected range (between the min and max) of the industry data. and Foster Audit Workpaper 50 B.3.3. pg. 10/2 you identify. 26. Prepare a memo to document your understanding of Alpine Cupcakes environment and provide your assessment of Garcia and Foster's audit risk. Describe the specific risks for Alpine Cupcakes, explain why you believe these factors relate to the Alpine Cupcakes audit, and identify which specific accounts are likely to be affected by these risks. Describe how the audit teams should address the risks identified. For example, the background information mentions that sugar prices may rise. What risks would this present to Alpine Cupcakes? Which accounts would be affected by this risk? How should the audit team address these risks in the audit plan? 120% Preliminary Analyti Audit Mar December 31, As of 12/31/20x1 $ Change As of 3/31/2002 *7.15% Current Assets Cash Storefront Cash Corporate Accounts $125,49876 293,72R03 123.432.43 122,849.12 2,379.00 4,277.00 25.190.66 1,423.05 3,340.30 $702,618.35 $135,135.15 210.019.06 124,726.15 193,976,31 2,604.00 4,713.00 25,580.09 1,190.10 3,260.80 $701,204.66 (8,636.39) 84,708 97 (293.72) (70,127.19 775.00 1,06400 610.52 1,232.95 1,079.50 22.5% 103.60% 33.11% Office Supplies Cooking Supplies Inventory Ingredients Inventory Cole Boxes and Cupcake Cups Inventory: Beverages Total Current Assets Long-Term Assets Equipment Accumulated Depreciation: Equipment Plant & Property Accumulated Depreciation: Plant & Proprty Land Total Long-Term assets Total Assets 150,180.00 150,180.00 (82,455.00) (78,828.00) 330,000.00 330,000.00 (82,500.00) 179,200.00) 125,000.00 125,000.00 440,225.00 $447,152.00 $1,142,843.35 $1,148,356.66 0.00 3,627.00 0.00 3,300.00 0.00 0.00% 4.60% 0.00% 4.17% 0.00% -33.315 3 0.00% (12,844.70) 0.00 (16,878.18) (13,125.00) (1,588.32) (2,322.78) -44.27% 4 -100.00% 5 -0.54% -9.34% Liabilities $25,712.00 38,556.70 Accounts Payable 0.00 0.00 Wage Taxes Payable 21, 247.78 38,125.96 Corporate Income Tax Payable 0.00 13,125.00 Dividends Payable Mortgage Payable 290,673.81 292,262.13 Notes Payable: Vehicles 22,555.53 24,878.31 Total Liabilities 360,189.12 $406,948.10 Stockholders' Equity Common Stock, Par value $1.00; Authorized 1,000,000; Issued and outstanding 50,000 shares 50,000.00 50,000.00 Additional Paid in Capital 120,075.91 120,075.91 Retained Earnings 612,578.32 571,332.65 Total Stockholders' Equity 782,654.23 $741,408.56 Total Liabilities and Stockholders' Equity $1,142,843.35 $1,148,356.66 F -The fluctuation is less than TM (523,700) and less than a 10% change. - Footed 1000 arcia and Foster Audit Workpaper 46 0.00 0.00 41,245.67 0.00% 0.00% 7.225 Pos 10% Charge} B.3.1: Pg 1012 by SOM 101/2003 Reviewed by TKJ 10/9/20X2 Alpine Cupcakes, Inc. Preliminary Analytical Procedures-Quarterly Income Statements Audit Year December 31, 20x2 /8.1.2 3 Months Ended 03/31/20X2 3 Months Ended 03/31/20x1 S Change % Change 1 1 Revenue Sales Revenue: Corporate Accounts Sales Revenues Storefront Total Sales Revenue Cost of Goods Sold: Ingredients Cost of Goods Sold: Boxes and Cupcake Cups Cost of Goods Sold: Beverages Total COGS Gross Profit Interest Revenue Gross Profit Plus Interest Revenue $353,739.57 $343,050.56 (10,689.01) 80,649.00 91,411.50 (10,762.50) 434,388.57 434,462.06 66,736.39 64,645.64 3,875.55 3,755.55 5,466.50 5,681.50 76,078,44 74,082.69 358,310.13 360,379.37 89.00 65.00 358,399.13 360,444.37 (73.49) 2,090.75 120.00 (215.00) 1,995.75 -3.12% -11.77% -0.01% 3.23% 3.20% -3.78% 2.69% 24.00 36.92% -0.49% -0.59% -52.63% 2 0.00% -4.78% Expenses Wage Expense Wage Tax Expense Medical Insurance Expense Auto Insurance Expense Interest Expense Electrical & Gas Service Expense Liability Insurance Expense Telecommunications Expense Cell Phone Service Expense Postage Expense Professional Services Expense Maintenance Expense Office Supplies Expense Dry Cleaning Expense Storefront Paper Supplies Expense Rental Expense Naste Services Expense 216,719.00 17,971.24 8,100.00 1,035.00 3,996.90 1,523.20 3,768.40 472.50 912.00 139.50 2,070.00 1,212.00 8,050.00 398.75 778.25 4,752.00 217,791.00 18,077.94 17,100.00 1,035.00 4,197.69 1,708.00 3,693.60 462.00 933.00 135.90 2,122.50 1,132.00 7,342.00 416.15 869.00 4,752.00 150.00 (1,072.00) (106.70) 19,000.00) 0.00 (200.79) (184.80) 74.80 10.50 (21.00) 3.60 (52.50) 80.00 708.00 (17.40) (90.75) 0.00 0.00 -10.82% 2.03% 2.27% -2.25% 2.65% -2.47% 7.07% 9.64% -4.18% -10.44% 0.00% 0.00% 150.00 und Foster Audit Workpaper Cambridge Business Publishers Performed by SOM 10/1/20 Reviewed by IKT 10/9/20X2 Alpine Cupcakes, Inc. Preliminary Analytical Procedures - Quarterly Income Statements Audit Year December 31, 20X2 18.1.2 3 Months Ended 03/31/20X2 3 Months Ended 03/31/20x1 $ Change % Change Expenses (continued) Car Maintenance and Fuel Expense Repair Expense Water Expense Soda Machine Repair and CO2 Expense Credit Card Expense Cooking Supplies Expense Banking Fees Selling and Administrative Expenses Depreciation Expense: Equipment Depreciation Expense: Plant & Property Total Depreciation Expense Total Expenses 995.38 372.50 378.75 1,156.00 878.31 12,704.00 445.00 288,978.68 3,627.00 3,300.00 6,927.00 295,905.68 1,026.78 381.25 373.75 1,128.00 897.89 11,858.00 445.00 (31.40) (8.75) 5.00 28.00 (19.58) 846.00 0.00 -3.06% -2.30% 1.34% 2.48% -2.1896 7.1396 0.00% 298,028.45 4,152.00 3,300.00 7,452.00 305,480.45 (525.00) 0.00 -12.64% 0.00% Earnings Before Income tax Income Tax Expense Net Income 62,493.45 21,247.78 $83,741.23 54,963.92 18,683.66 $73,647.58 2.564.12 13.72% 7. Auditor Notes The fluctuation is less than TM ($2.700) and less than a 10% change. F-Footed 19,050 1 - The Company has seen decreases in both their corporate and storefront sales. The Company has experienced a decrease in birthday party and holiday orders leading to the decline in storefront sales. Most customers order these items a week before the event and pick them up in the store. The decrease in corporate accounts revenue is primarily due to two customers, Luigi's Bistro and Steinberg Delis. The Company expects corporate sales to pick up through the rest of the year. 2. We discussed the change in the medical insurance expense account with Lindsay McKenna. Lindsay said the increase in medical insurance expense from prior year is due to accidentally paying $3,000 more on each check that was written to Blue Cross Blue Shield in Q1 of 20X1. The Company received a refund of 39,000 from the medical insurance company in April 20X due to the mistakes in payments. Tcia and Foster Audit Workpaper 49 Alpine Reviewed by TK 10/9/2012 Preliminary Analytical Procedures-Ratio Anal Audit Year December 31, 20X2 nuk: thy should hare looking the Katos kry from As, ma, ma Company Ratios 3/31/20X2 3/31/20x1 % Change 7.094 60.1% 1, 11 360 10.875 6.696 62.4% 1, 2.879 2.150 33.9% 2, 126.760 169.745 -25.3% 2, 2.540 2.506 1.4% V. 143.710 145.654 -1.3% V. 4.710 4.865.43 -3.2% VH 0.095 0.084 0.036 0.036 0.053 0.060 0.274 0.330 0.400 0.540 Current Ratio Quick Ratio Receivables Turnover Pays Outstanding in Receivables inventory Turnover pays of Inventory on Hand Gross Profit Percentage Profit Margin Return on Assets Return on Equity Debt to Assets Debt to Equity 2 0.82 Comportestle/ 13.1% 3 0.0% V. -11.7% 9H -17.0% 5. -25.9% 5. Account Rec? March 20x1 Avg 5.55 4.50 2.97 (150.08 1.62 Max 13.76 12.45 Current Ratio Quick Ratio Receivables Turnover Days Outstanding in Receivables Inventory Turnover Days of Inventory on Hand Gross Profit Percentage Profit Margin Return on Assets Return on Equity Debt to Assets Debt to Equity Industry Ratios March 20X2 Min Max Avg 1.05 15.30 5.70 0.77 14.00 4.54 1.28 5.68 2.66 64.30 285.43 159.54 0.24 3.95 1.51 92.29 1525.44 458.39 0.01 0.49 0.33 -0.09 0.10 0.11 -0.03 0.04 0.04 -0.04 0.23 0.08 0.00 0.74 0.19 -0.05 1.76 0.58 Min 2.02 1.06 1.09 82.83 0.20 87.88 0.10 -0.09 -0.02 -0.16 441 54 333.76 4.15 1830.71 0.48 1.02 0.31 0.02 0.01 -0.04 021 9.26 0.29 0.67 0.55 3.99 0.00 0.00 Auditor Notes Calculation includes current portion of mortgage payable and notes payable based on client's amortization schedule. On 3/31/20X2, the current portions of the mortgage and notes payables are 56,555.19 and $8,337.88, respectively. On 3/31/20X2, the current portions of the mortgage and notes payables are $6,236.12 and 59,103-75, respectively. Fluctuation meets expectations of being less than a 10% change. The 20X2 ratio is within the expected range (between the min and max) of the industry data. and Foster Audit Workpaper 50 B.3.3. pg. 10/2