

Answered step by step
Verified Expert Solution
Question
1 Approved Answer
you must use matlab or octave program. others are not allowed T.T. please use only above the two program to get solution. Problem 2: Empirical
you must use matlab or octave program. others are not allowed T.T. please use only above the two program to get solution.
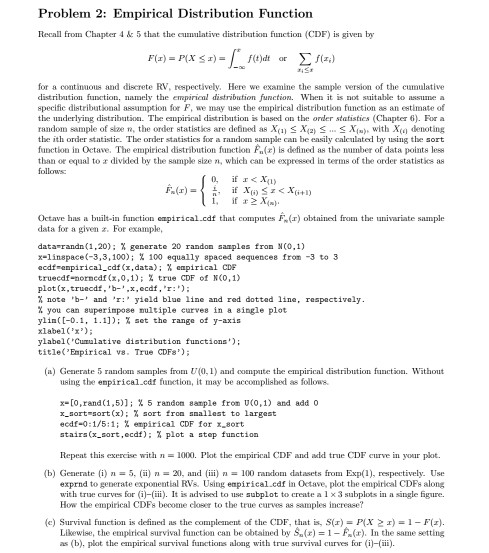
Problem 2: Empirical Distribution Function Recall from Chapter 4 & 5 that the cumulative distribution function (CDF) is given by f(t)dt or for a continuous and discrete RW, respectively. Here we examine the sample version of the cumulative distribution function. namely the empirical distribution fun nction. When t is not suitable to assume a specific distributional assumption for F, we may use the empirical distribution function as an estimate of the underlying distribution. The eampirical distribution is based on the order statistics (Chapter 6). For a random sample of size n, the order statistica are defined as X SXK2) S S Xiu), with Xo denoting the ith order statistic. The order statistics for a randonn sam can be easi calculated by using the sort function in Octave. The empirical distribution function Fa(z) is defined as the number of data points less than or equal to a divided by the sample size n, which can be expressed in terms of the order statistics as S z if a X octave has a built-in function empirical-cdf that computes FN(r) obtained from the univariate sample data for a given z. For example, data randn (1.20): generate 20 randon samples fron N(0,1) x-lin space (-3,3,100); X 100 equally spaced sequences from -3 to 3 cdf menpirical-cdf (x,data) empir ical CDF truecdf-norncdf (x 0,1); true CDF of N (0,1) note 'b-' and 'r yield blue line and red dotted line respectively you can superimpose nultiple curves in a single plot ylin -0.1 1.1]) set the range of y-axis xlabel( ylabel( cumulative distribution functions title 'Empirical v8. True CDFs (a) Generate 5 random samples from U(0,1) and corn the empirical distribution function. Without pute using the enpirical-cdf function, it may be accomplisbed as follows. x- [0,rand(1,5 5 random 8ample from UCo.1) and add o x-sort sort (x sort from snallest to largest ecdf-0:1/5:1; empirical CDF for 1.8ort stairs Cx-sort ecdf plot a step function Repeat this exercise with n 1000. Plot the empirical CDF and add true CDF curve in your plot. (b) Generate (i) n 5, (ii) n 20, and (iii) n 100 random datasets from Exp( respectively. Use exprnd to generate exponential RVs. Using empirical cdf im Octave, plot the empirical CDFs along with true curves for (i)-(iii). It is advised to use subplot to create a 1 x 3 subplots in a single figure. How the empirical CDFs become closer to the true curves as samples increase? (e) Survival function is defined as the com of the CDF, that is, S(r) P(X 2 z) 1 F(z). Likewise, the empirical survival function can be obtained by Sa(z) 1- F (r). In the same setting as (b), plot the empirical survival functions along with true survival curves for (i-(iii)Step by Step Solution
There are 3 Steps involved in it
Step: 1

Get Instant Access to Expert-Tailored Solutions
See step-by-step solutions with expert insights and AI powered tools for academic success
Step: 2

Step: 3
Ace Your Homework with AI
Get the answers you need in no time with our AI-driven, step-by-step assistance
Get Started
Essentials of Database Management
Authors: Jeffrey A. Hoffer, Heikki Topi, Ramesh Venkataraman
1st edition
133405680, 9780133547702 , 978-0133405682