You need Sensor.dat https://drive.google.com/drive/my-drive
Please use matlab
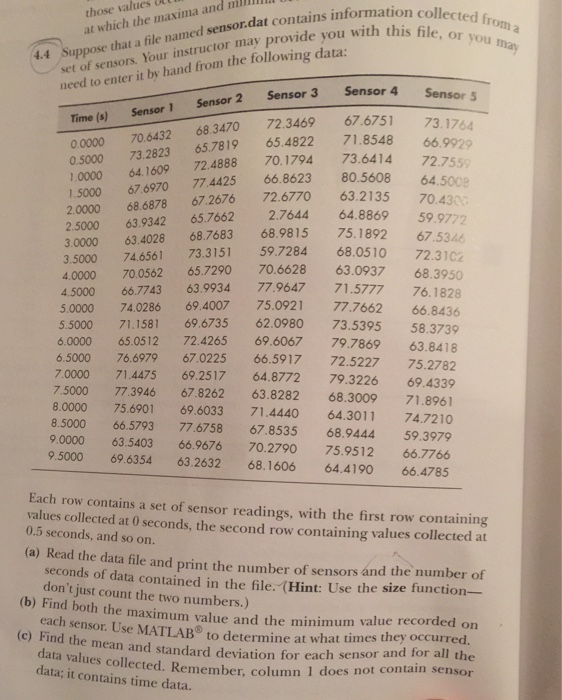
Ull milI collected from a or you may those values at which the maxima and set of sensors. need to enter it by hand from the following Your instructor may provide you with this file data: 4.4 Suppose that a file named sensor.dat conta Sensor 3 Sensor 4 Sensor 2 Sensor 1 Time (s) 0000 706432 68.3470 72.3469 67.6751 0.5000 73.2823 65.7819 65.4822 71.8548 72.4888 70.1794 73.6414 72.75 10000 64.1609 1.5000 67 6970 77.4425 66.8623 80.5608 2.0000 68.6878 67.2676 72.6770 63.2135 2.5000 63.9342 65.7662 2.7644 64.8869 59.9772 3.0000 63.4028 68.7683 68.9815 75.1892 3.5000 74.6561 73.3151 59.7284 68.0510 72.31 4.0000 70.0562 65.7290 70.6628 63.0937 68.395 4.5000 66.7743 63.9934 77.9647 71.5777 76.182 5.0000 74.0286 69.4007 75.0921 77.7662 668436 5.5000 71.1581 69.6735 62.0980 73.5395 58.3739 6.0000 65.0512 72.4265 69.6067 79.7869 63.8418 6.5000 76.6979 67.0225 66.5917 72.522775.2782 7.0000 71.4475 69.2517 64.8772 79.3226 69.4339 7.5000 77.3946 67.8262 63.8282 68.3009 71.8961 8.0000 75.6901 69.6033 71.4440 64.3011 74.7210 8.5000 66.579377.675867.8535 68.9444 59.3979 9.0000 63.540366.9676 70.2790 75.9512 66.7766 9.5000 69.635463.2632 68.1606 64.4190 66.4785 Each row contains a set of sensor readings, with the first row containing values collected at 0 seconds, the second row containing values collected at 0.5 seconds, and so on. (a) Read the data file and print the number of sensors and the number of seconds of data contained in the file (Hint: Use the size function- maximum value and the minimum value recorded on standard deviation for each sensor and for all the don't just count the two numbers.) (c) Find the mean and Use MATLAB to determine at what times they occurred data values collected. data; it contains time data. td Remember, column 1 does not contain sensor column Ull milI collected from a or you may those values at which the maxima and set of sensors. need to enter it by hand from the following Your instructor may provide you with this file data: 4.4 Suppose that a file named sensor.dat conta Sensor 3 Sensor 4 Sensor 2 Sensor 1 Time (s) 0000 706432 68.3470 72.3469 67.6751 0.5000 73.2823 65.7819 65.4822 71.8548 72.4888 70.1794 73.6414 72.75 10000 64.1609 1.5000 67 6970 77.4425 66.8623 80.5608 2.0000 68.6878 67.2676 72.6770 63.2135 2.5000 63.9342 65.7662 2.7644 64.8869 59.9772 3.0000 63.4028 68.7683 68.9815 75.1892 3.5000 74.6561 73.3151 59.7284 68.0510 72.31 4.0000 70.0562 65.7290 70.6628 63.0937 68.395 4.5000 66.7743 63.9934 77.9647 71.5777 76.182 5.0000 74.0286 69.4007 75.0921 77.7662 668436 5.5000 71.1581 69.6735 62.0980 73.5395 58.3739 6.0000 65.0512 72.4265 69.6067 79.7869 63.8418 6.5000 76.6979 67.0225 66.5917 72.522775.2782 7.0000 71.4475 69.2517 64.8772 79.3226 69.4339 7.5000 77.3946 67.8262 63.8282 68.3009 71.8961 8.0000 75.6901 69.6033 71.4440 64.3011 74.7210 8.5000 66.579377.675867.8535 68.9444 59.3979 9.0000 63.540366.9676 70.2790 75.9512 66.7766 9.5000 69.635463.2632 68.1606 64.4190 66.4785 Each row contains a set of sensor readings, with the first row containing values collected at 0 seconds, the second row containing values collected at 0.5 seconds, and so on. (a) Read the data file and print the number of sensors and the number of seconds of data contained in the file (Hint: Use the size function- maximum value and the minimum value recorded on standard deviation for each sensor and for all the don't just count the two numbers.) (c) Find the mean and Use MATLAB to determine at what times they occurred data values collected. data; it contains time data. td Remember, column 1 does not contain sensor column