Answered step by step
Verified Expert Solution
Link Copied!

Question

1 Approved Answer

You need to do internet or literature search for any plot (graph, stairs, bars, pie,... ete) that is showing any useful data in any topic
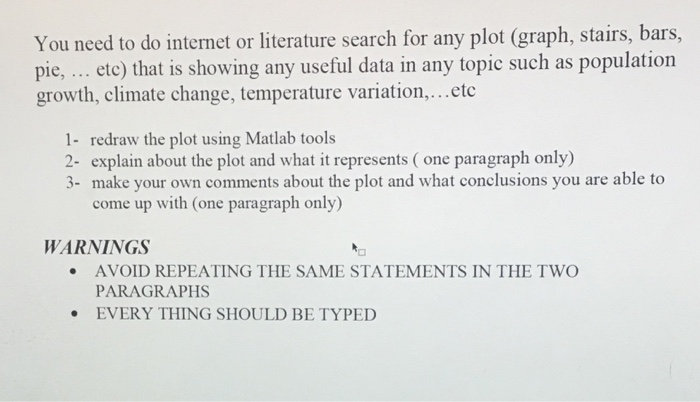
image text in transcribed
You need to do internet or literature search for any plot (graph, stairs, bars, pie,... ete) that is showing any useful data in any topic such as population growth, climate change, temperature variation,...etc 1- redraw the plot using Matlab tools 2- explain about the plot and what it represents (one paragraph only 3- make your own comments about the plot and what conclusions you are able to come up with (one paragraph only) WARNINGS AVOID REPEATING THE SAME STATEMENTS IN THE TWO PARAGRAPHS EVERY THING SHOULD BE TYPEID

Step by Step Solution

There are 3 Steps involved in it

Step: 1

blur-text-image

Get Instant Access to Expert-Tailored Solutions

See step-by-step solutions with expert insights and AI powered tools for academic success

Step: 2

blur-text-image_2

Step: 3

blur-text-image_3

Ace Your Homework with AI

Get the answers you need in no time with our AI-driven, step-by-step assistance

Get Started

Students also viewed these Databases questions

Question

Explain what a feasibility analysis is and why its important.

Answered: 1 week ago