

Answered step by step
Verified Expert Solution
Question
1 Approved Answer
you need to t It's safer Protected View. Enable Editing system is being developed in-house and is considered leading-edge by the industry. Financial Data
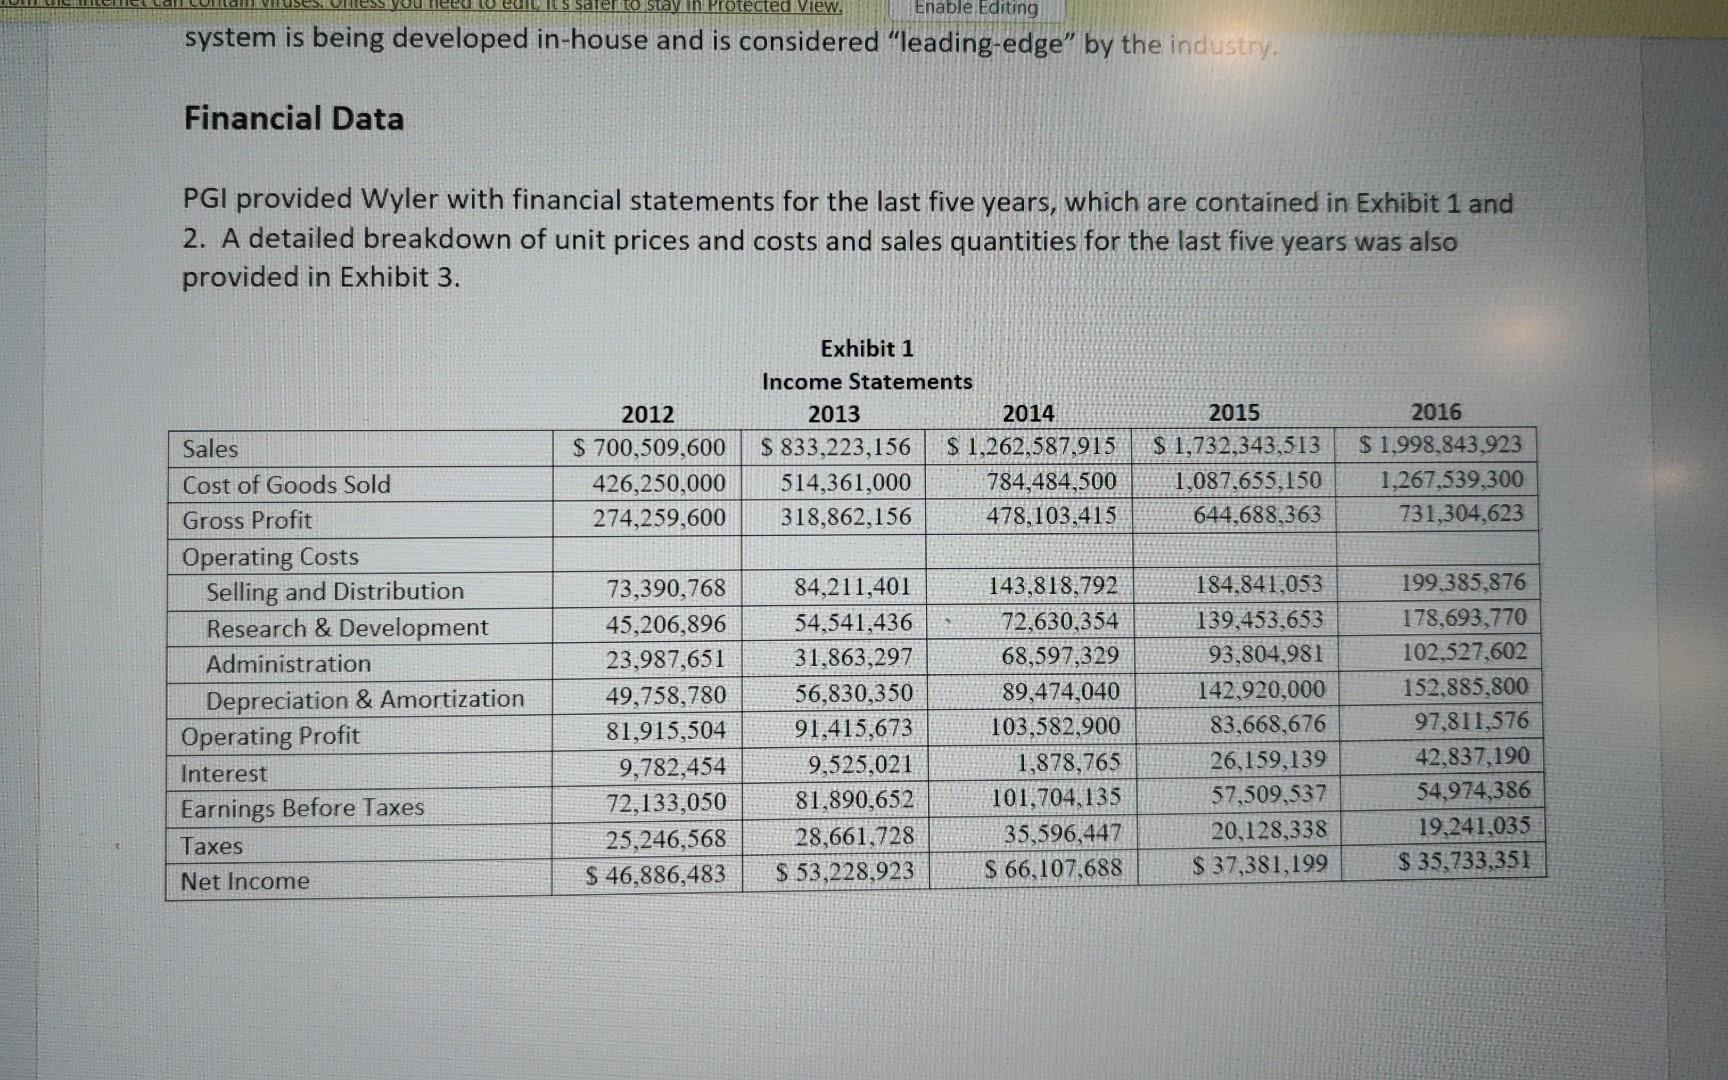
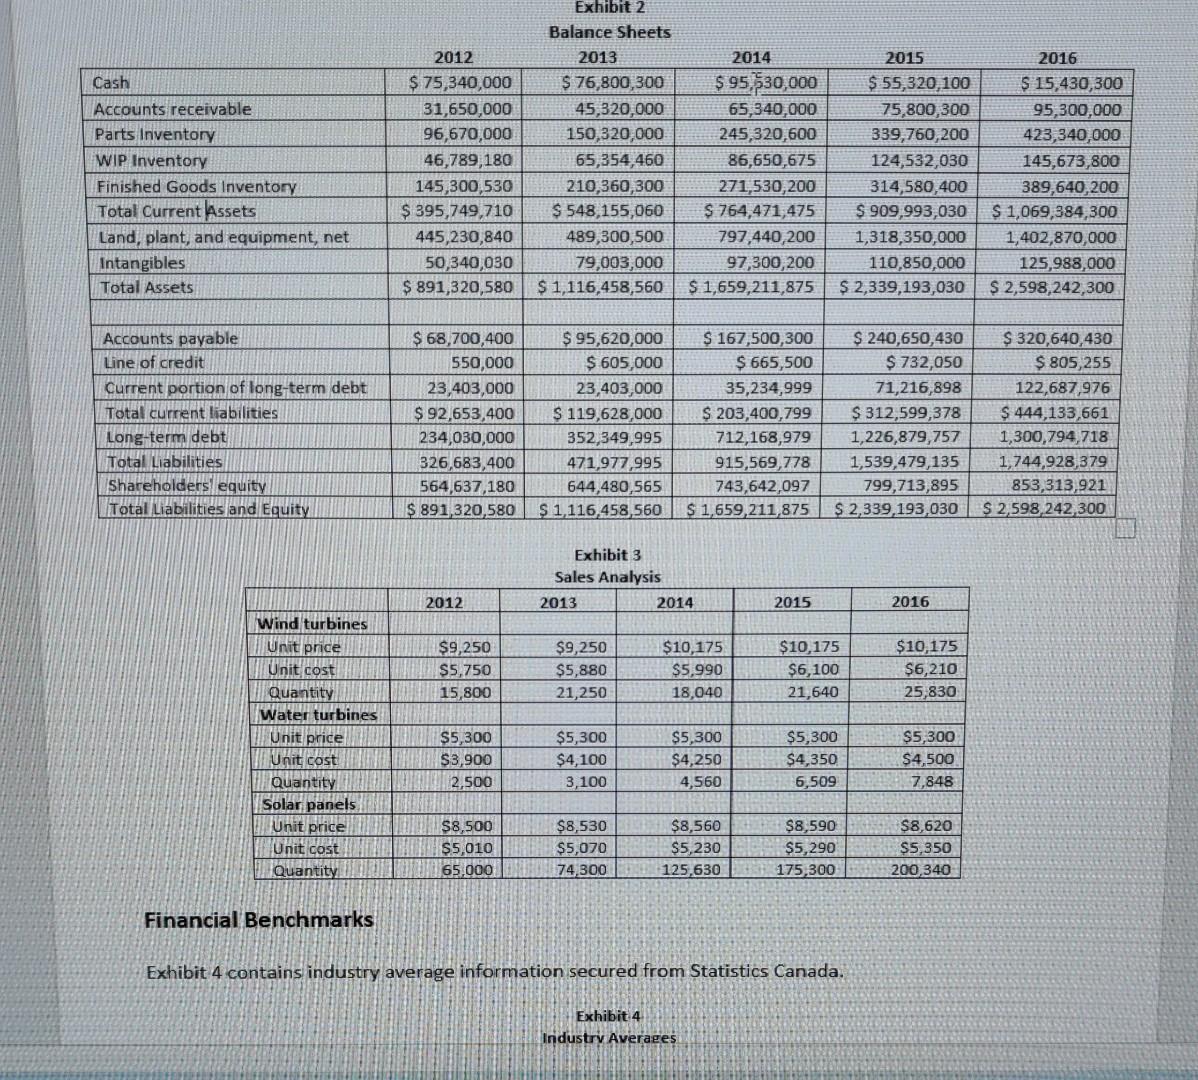
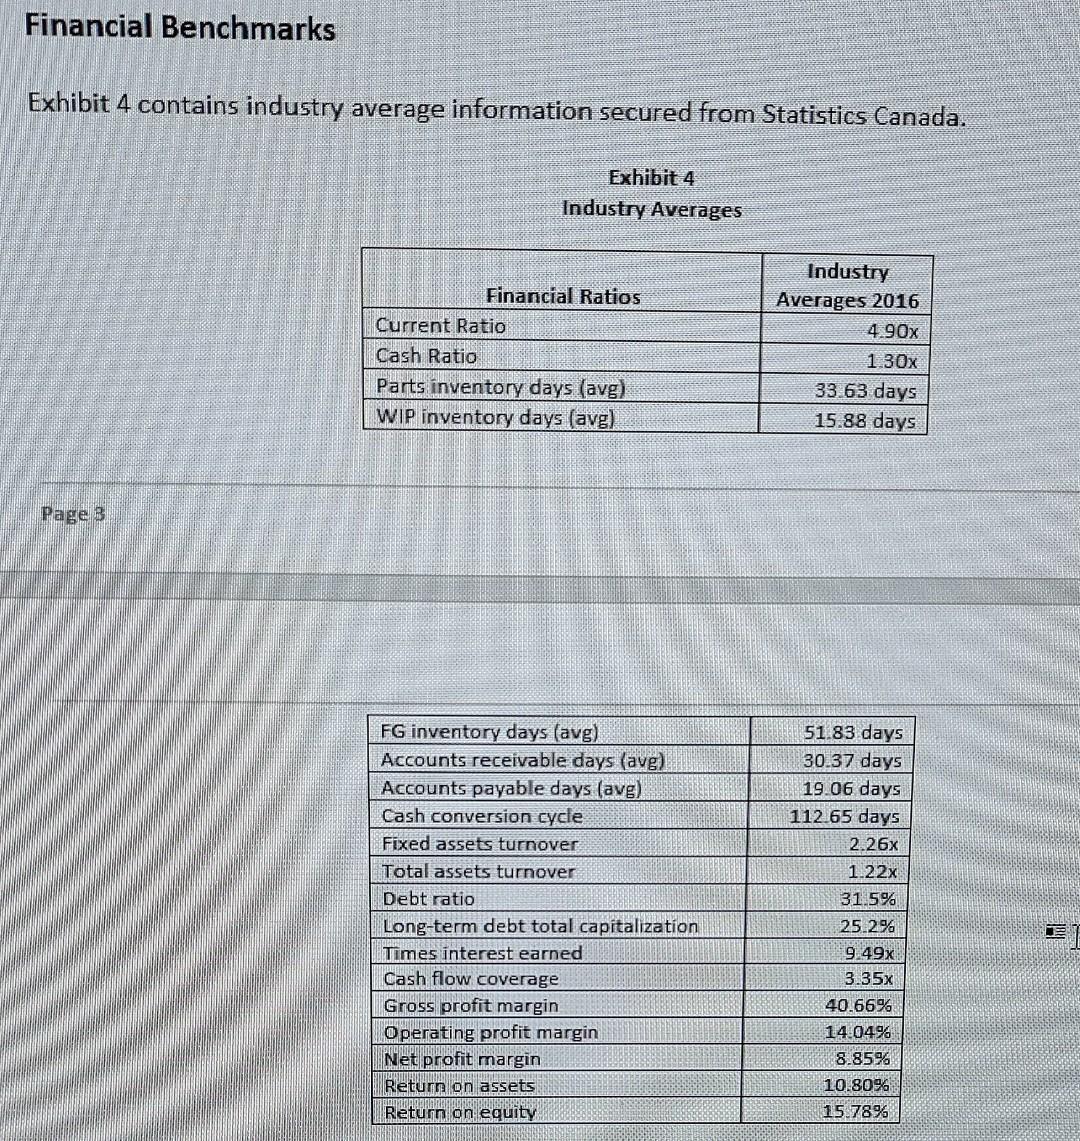


you need to t It's safer Protected View. Enable Editing system is being developed in-house and is considered "leading-edge" by the industry. Financial Data PGI provided Wyler with financial statements for the last five years, which are contained in Exhibit 1 and 2. A detailed breakdown of unit prices and costs and sales quantities for the last five years was also provided in Exhibit 3. Exhibit 1 Income Statements 2013 2012 2014 2015 Sales Cost of Goods Sold Gross Profit $ 700,509,600 426,250,000 274,259,600 $ 833,223,156 514,361,000 318,862,156 $ 1,262,587,915 784,484,500 478,103,415 $ 1,732,343,513 1,087,655,150 644,688,363 2016 $ 1,998,843,923 1,267,539,300 731,304,623 Operating Costs Selling and Distribution 73,390,768 84,211,401 143,818,792 184,841,053 199,385,876 Research & Development 45,206,896 54,541,436 72,630,354 139,453,653 178,693,770 Administration 23,987,651 31,863,297 68,597,329 93,804,981 102,527,602 Depreciation & Amortization 49,758,780 56,830,350 89,474,040 142,920,000 152,885,800 Operating Profit 81,915,504 91,415,673 103,582,900 83,668,676 97,811,576 Interest 9,782,454 Earnings Before Taxes 72,133,050 Taxes 25,246,568 1,878,765 101,704,135 35,596,447 Net Income $ 46,886,483 $ 53,228,923 9,525,021 81,890,652 28,661,728 $ 66,107,688 $ 37,381,199 19,241,035 $ 35,733,351 26,159,139 42,837,190 57,509,537 54,974,386 20,128,338
Step by Step Solution
There are 3 Steps involved in it
Step: 1

Get Instant Access to Expert-Tailored Solutions
See step-by-step solutions with expert insights and AI powered tools for academic success
Step: 2

Step: 3
Ace Your Homework with AI
Get the answers you need in no time with our AI-driven, step-by-step assistance
Get Started
Financial Accounting
Authors: W. Steve Albrecht, James D. Stice, Earl K. Stice
10th edition
324645570, 978-0324645576