

Question
You own a bakery and decide to compare your weekly flour consumption in pounds (x - input variable) and the sales you make in dollars
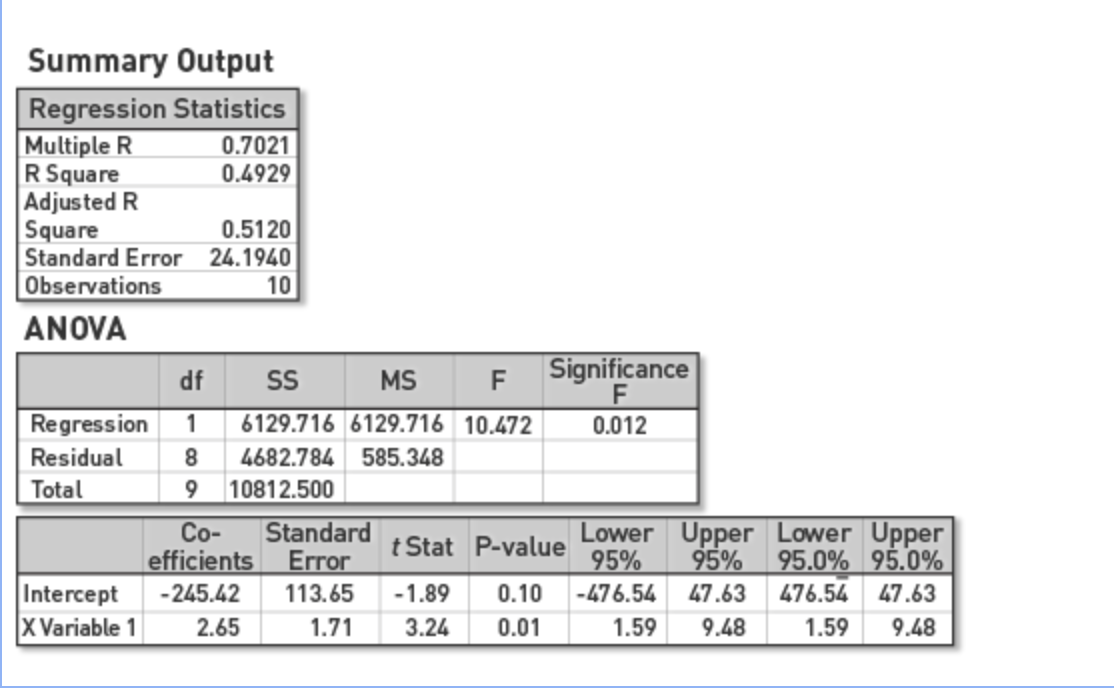
You own a bakery and decide to compare your weeklyflour consumptionin pounds (x - input variable) and thesalesyou make in dollars (y -output variable) each week. You enter your raw data into Excel and run a simple linear regression. Below are your summary output results.
ReferencingFigure 1 Excel summary outputshown, predict sales based on consuming 5000 lbs. of flour.
Step by Step Solution
There are 3 Steps involved in it
Step: 1

Get Instant Access to Expert-Tailored Solutions
See step-by-step solutions with expert insights and AI powered tools for academic success
Step: 2

Step: 3
Ace Your Homework with AI
Get the answers you need in no time with our AI-driven, step-by-step assistance
Get Started
Physics For Scientists And Engineers
Authors: Raymond A Serway, John W Jewett
10th Edition
1337671711, 9781337671712