

Answered step by step
Verified Expert Solution
Question
1 Approved Answer
You plot your raw interval data you collected randomly from two groups and get the curves below. Use this information to answer questions 4 and
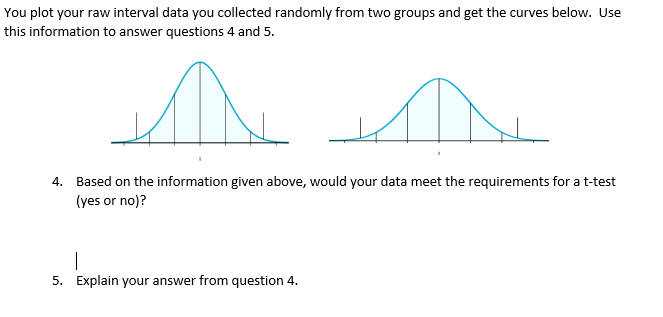
You plot your raw interval data you collected randomly from two groups and get the curves below. Use this information to answer questions 4 and 5.
- Based on the information given above, would your data meet the requirements for a t-test (yes or no)?
- Explain your answer from question 4.
Step by Step Solution
There are 3 Steps involved in it
Step: 1

Get Instant Access to Expert-Tailored Solutions
See step-by-step solutions with expert insights and AI powered tools for academic success
Step: 2

Step: 3
Ace Your Homework with AI
Get the answers you need in no time with our AI-driven, step-by-step assistance
Get Started