

Answered step by step
Verified Expert Solution
Question
1 Approved Answer
You ran a regression of a stock's monthly excess return versus market index monthly excess returns and find the following: Coefficients Standard Error t-statistic p-value
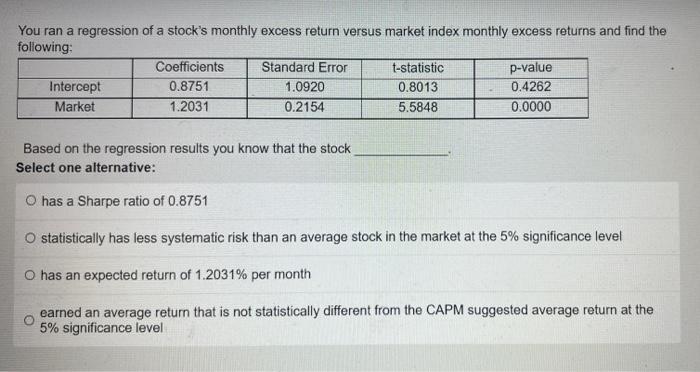 You ran a regression of a stock's monthly excess return versus market index monthly excess returns and find the following: Coefficients Standard Error t-statistic p-value Intercept 0.8751 1.0920 0.8013 0.4262 Market 1.2031 0.2154 5.5848 0.0000 Based on the regression results you know that the stock Select one alternative: O has a Sharpe ratio of 0.8751 statistically has less systematic risk than an average stock in the market at the 5% significance level O has an expected return of 1.2031% per month earned an average return that is not statistically different from the CAPM suggested average return at the 5% significance level
Step by Step Solution
There are 3 Steps involved in it
Step: 1

Get Instant Access to Expert-Tailored Solutions
See step-by-step solutions with expert insights and AI powered tools for academic success
Step: 2

Step: 3
Ace Your Homework with AI
Get the answers you need in no time with our AI-driven, step-by-step assistance
Get Started
Theory Of Constraints Handbook
Authors: James Cox, John Schleier
1st Edition
0071665544, 978-0071665544