Question
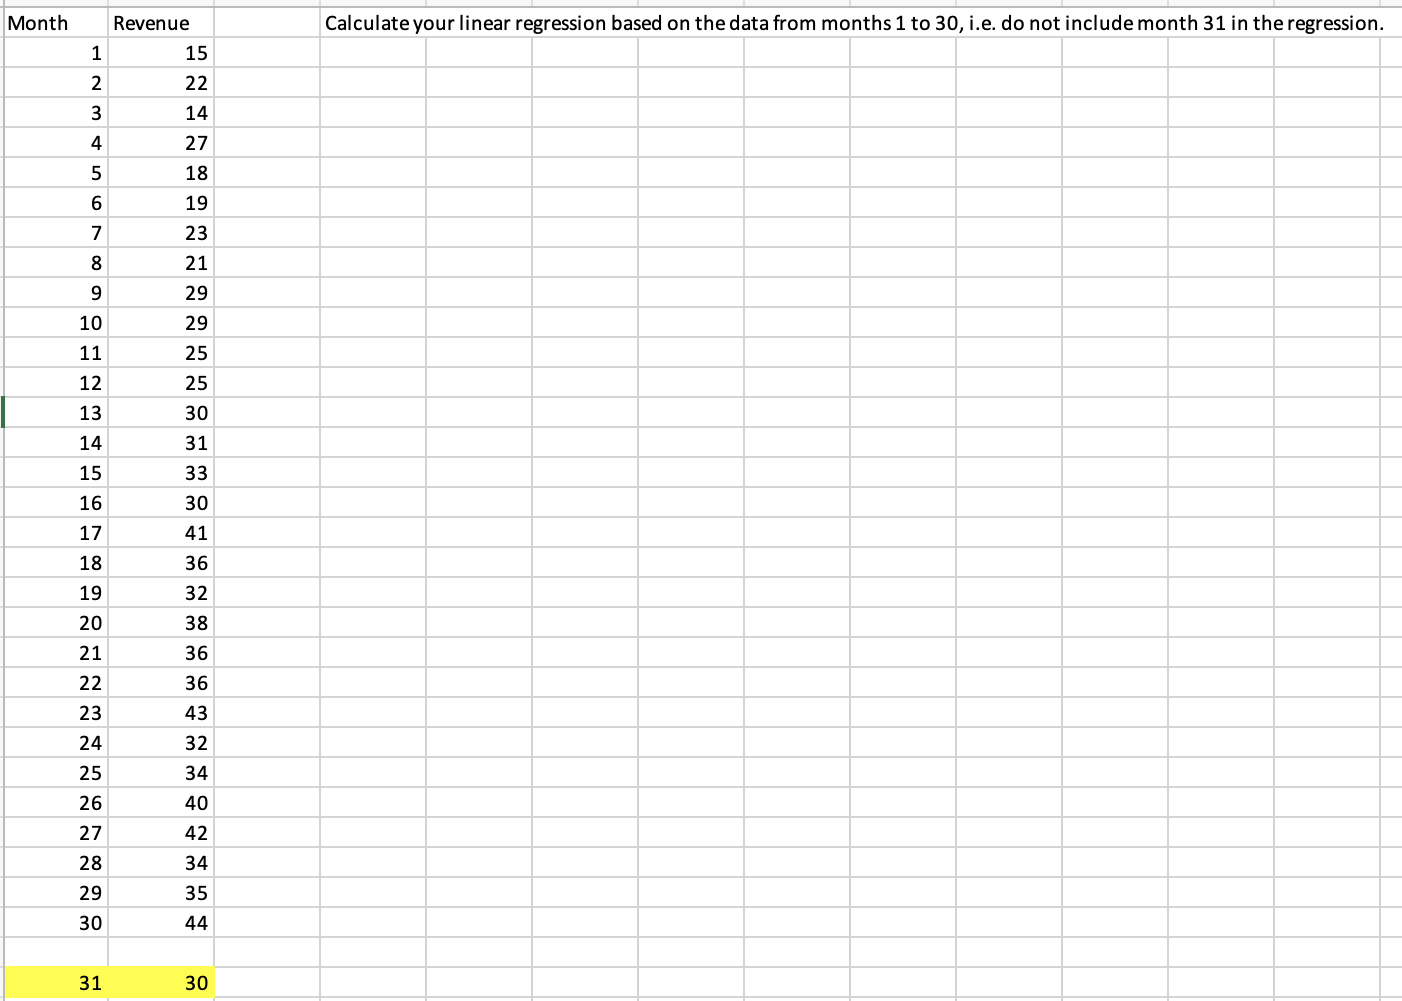
You run a pet-grooming business, Paws For Effect. Over the last few years, you have steadily built your business. The data set paws.xls contains sales
You run a pet-grooming business, Paws For Effect. Over the last few years, you have steadily built your business. The data set paws.xls contains sales data for the last 30 + 1 = 31 months. In the most recent month a competitor business, Furrtasic Felines, has set up nearby. Your task is to develop a linear model that can predict revenue based on month for the first 30 months' data. Subsequently, you want to evaluate if the revenue for month 31 is significantly lower than might be expected from natural variation.
Question
a) Create an appropriately formatted figure of the data, paying attention to labels and number formats. Include the line of best fit. The figure should also include an informative caption.
b) About how many points would you expect to see more than 2se from the line? How many are there actually?
c) Linear regression makes some quite strong assumptions about the data including that:
i. The variation around the line, i.e. the error term, should be the same everywhere (we also assume the error term follows a normal distribution).
ii. The mean values of the response variable for different values of the explanatory variable should fall on a straight line.
How well do you think this data set meets the assumptions above?
d) Based on your model for months 1 to 30 what is the predicted revenue in month 31? Discuss how accurate you expect this prediction to be.
e)On the basis of this data, explain whether you worried about the competition from Furrtastic Felines?
f) On the basis of your linear regression model, predict what Paws for Effect's revenue would have been 60 months ago (i.e. at month -30). Explain why your prediction is problematic.
g) Research question. Describe the difference between cross sectional and data time series data. Use the internet or a statistics text to research the "LINE" assumptions for regression, and identify which one of these assumptions is commonly violated with time series data.

Step by Step Solution
There are 3 Steps involved in it
Step: 1

Get Instant Access to Expert-Tailored Solutions
See step-by-step solutions with expert insights and AI powered tools for academic success
Step: 2

Step: 3

Ace Your Homework with AI
Get the answers you need in no time with our AI-driven, step-by-step assistance
Get Started


