

Answered step by step
Verified Expert Solution
Question
1 Approved Answer
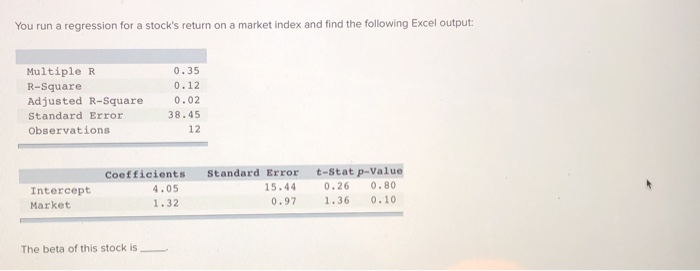
You run a regression for a stock's return on a market index and find the following Excel output: Multiple R R-Square Adjusted R-Square Standard Error

Step by Step Solution
There are 3 Steps involved in it
Step: 1

Get Instant Access to Expert-Tailored Solutions
See step-by-step solutions with expert insights and AI powered tools for academic success
Step: 2

Step: 3
Ace Your Homework with AI
Get the answers you need in no time with our AI-driven, step-by-step assistance
Get Started
Essentials of Managerial Finance
Authors: Scott Besley, Eugene F. Brigham
14th edition
324422709, 324422702, 978-0324422702