Answered step by step
Verified Expert Solution
Question
1 Approved Answer
You should answer the following questions using the data from the case study: Should Marshall continue to pursue a high-growth strategy? How can she finance
You should answer the following questions using the data from the case study:
- Should Marshall continue to pursue a high-growth strategy? How can she finance it? What is the potential effect of growth on Burton's stock price?
- Should Marshall purchase the thermowell machines? In calculating the weighted-average cost of capital, use 5.8% as the market risk premium.
- Should Marshall accept the offer of the private investor and issue new equity? How does the deal affect Burton's existing shareholders? What is the effect of the issuance on Burton's balance sheets?
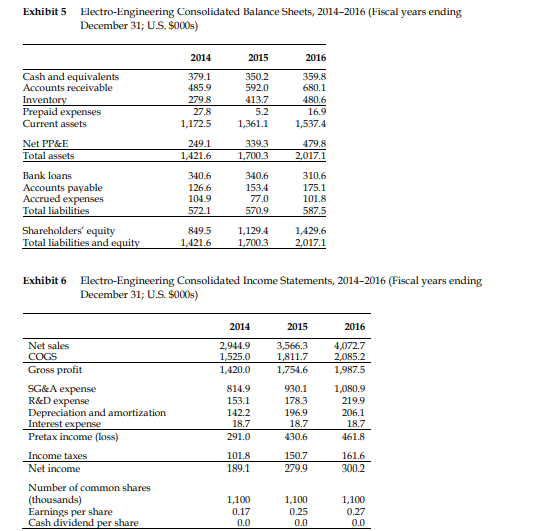
- Should Marshall acquire Electro-Engineering, Inc. (EE)? What is the most important consideration? Even if the NPV of the acquisition is zero, should she still proceed? (To derive the pro-forma balance sheets, you will need to make assumptions about the levels of capital expenditures, accounts receivable, inventory, prepaid expenses, accounts payable and accrued expenses, and taxes. You can use the 3-year historical average of these variables as a percentage of sales for projections.)
- Does the acquisition allow Burton to gain enough funding to invest in the purchase of thermowell machines?
PLEASE ANSWER ALL
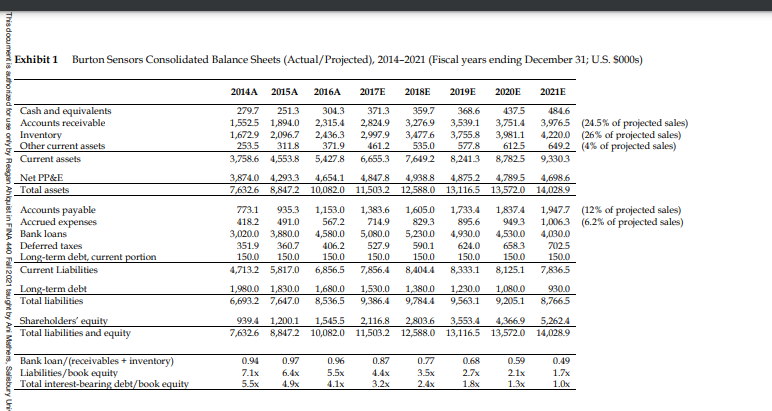
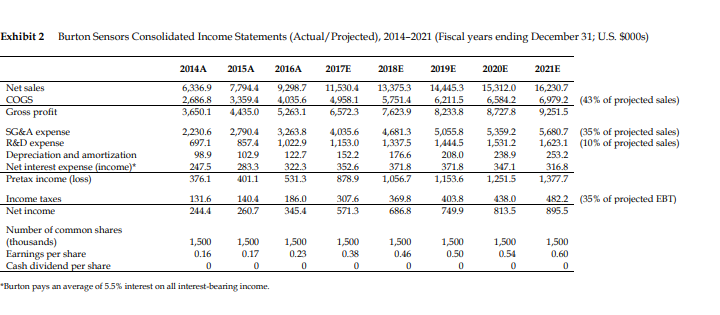
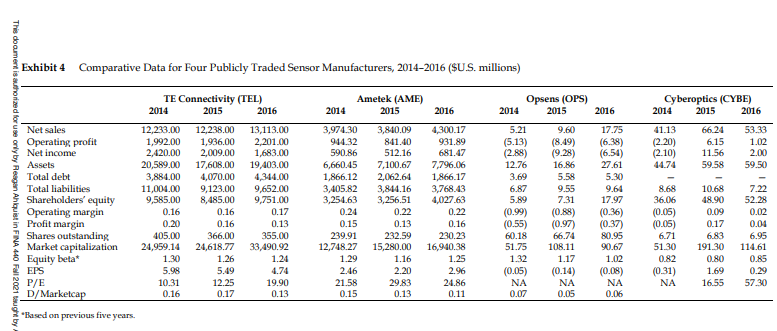
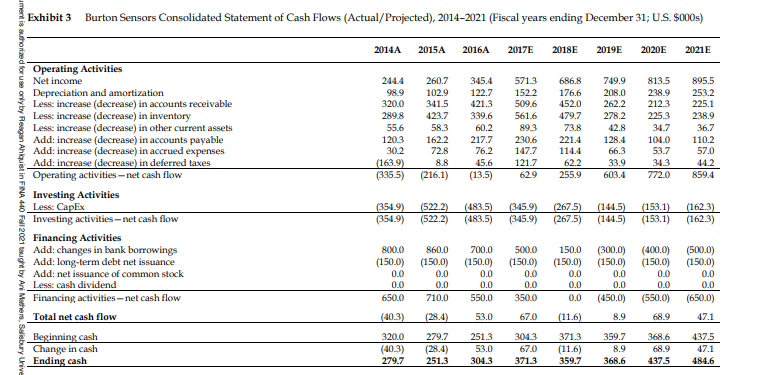
Exhibit 1 Burton Sensors Consolidated Balance Sheets (Actual/Projected), 2014-2021 (Fiscal years ending December 31; U.S. S000s) 2014A 2015A 2016A 2017E 2018E 2019E 2020E 2021E Cash and equivalents Accounts receivable Inventory Other current assets Current assets 279.7 251.3 1,5525 1,894.0 1,672.9 2,096.7 253.5 311.8 3,758.6 4,553.8 304.3 2,315.4 2,436.3 371.9 5,427.8 4,654.1 10,082.0 3,874.0 4,2933 7,6326 8,817.2 This document is authorized for use only by Reagan Ahlquist in FINA 440 Fall 2021 taught by Ani Mothers, Salisbury - Net PP&E Total assets Accounts payable Accrued expenses Bank loans Deferred taxes Long-term debt, current portion Current Liabilities Long-term debt Total liabilities Shareholders' equity Total liabilities and equity 371.3 359.7 368.6 437-5 484.6 2,824.9 3,276.9 3,539.1 3,751.4 3,9765 (24.5% of projected sales) 2.997.9 3,477.6 3,755.8 3,981.1 4,220.0 (26% of projected sales) 461.2 535.0 577.8 6125 649.2 (4% of projected sales) 6,655.3 7,6492 8,241.3 8,7825 9,3303 4,847.8 4,938.8 4,875 2 4.789.5 4,698.6 11,503.2 12,588.0 13,116.5 13,572.0 14,028.9 1,383.6 1,605.0 1,733.4 1,837.4 1,9477 (12% of projected sales) 714.9 829.3 895.6 949.3 1,0063 (6.2% of projected sales) 5,080.0 5,230.0 4,930.0 4,530,0 4,030.0 527.9 590.1 624.0 658.3 7025 150.0 150.0 150.0 150.0 150.0 7,856.4 8,404.4 8,333.1 8,125.1 7,836.5 773.1 935.3 4182 491.0 3,020.0 3,880.0 351.9 360.7 150.0 150.0 4,713.2 5,817.0 1,153.0 567.2 4,580.0 406.2 150.0 6,856,5 1,980.0 1,830.0 6,693.2 7,647.0 1,680.0 8,536.5 1,530.0 9,386.4 1380.0 9,784.4 1,230.0 9,563.1 1,080.0 9,205.1 930.0 8,766,5 939.4 1,200.1 7,6326 8.847.2 1,545.5 10,082.0 2,116.8 2.803.6 3,553.4 4,366.9 5,262.4 11,503.2 12,588.0 13,116.5 13,572.0 14,028.9 0.87 Bank loan/(receivables + inventory) Liabilities/book equity Total interest-bearing debt/book equity 0.94 7.1x 5.5x 0.97 6.4x 4.9x 0.96 5.5x 4.1x 0.77 3.5x 2.4x 0.68 2.7x 1.8% 0.59 2.1x 1.3x 0.49 1.7x 1.Ox 3.2x Exhibit 4 Comparative Data for Four Publicly Traded Sensor Manufacturers, 20142016 (SU.S. millions) 2014 Opsens (OPS) 2015 Cyberoptics (CYBE) 2014 2015 2016 2016 17.75 41.13 (2.20) (2.10) 44.74 66.24 6.15 11.56 59.58 53.33 1.02 2.00 59.50 This document is authorized for use only by Reagan Ahlquist in FINA 440 Fall 2021 taught by 8.68 TE Connectivity (TEL) 2014 2015 2016 Net sales 12,233.00 12,238.00 13,113.00 Operating profit 1,992.00 1,936.00 2,201.00 Net income 2,420.00 2,009.00 1.683.00 Assets 20,589.00 17,608.00 19,403.00 Total debt 3,884.00 4,070.00 4,344.00 Total liabilities 11,004,00 9,123.00 9,652.00 Shareholders' equity 9,585.00 8,485.00 9,751.00 Operating margin 0.16 0.16 0.17 Profit margin 0.20 0.16 0.13 Shares outstanding 405.00 366.00 355.00 Market capitalization 24,959.14 24,618.77 33,490.92 Equity beta* 1.30 1.26 1.24 EPS 5.98 5.49 4.74 P/E 10.31 12.25 19.90 D/Marketcap 0.16 0.17 0.13 Based on previous five years. Ametek (AME) 2014 2015 2016 3,974.30 3,840.09 4,300.17 944.32 841.40 931.89 590.86 512.16 681.47 6,660.45 7,100.67 7,796.06 1,866.12 2,062.64 1.866.17 3,405.82 3,844.16 3,768.43 3,254.63 3,256.51 4,027.63 0.24 0.22 0.22 0.15 0.13 0.16 239.91 232.59 230.23 12,748.27 15,280.00 16,940.38 1.29 1.16 1.25 2.46 2.20 2.96 21.58 29.83 24.86 0.15 0.13 0.11 9.60 (8.49) (9.28) 16.86 5.58 9.55 7.31 (0.88) (0.97) 66.74 108.11 7.22 52.28 5.21 (5.13) (2.88) 12.76 3.69 6.87 5.89 (0.99) (0.55) 60.18 51.75 1.32 (0.05) NA 0.07 0.02 (6.54) 27.61 5.30 9.64 17.97 (0.36) (0.37) 80.95 90.67 1.02 (0.08) NA 0.06 36.06 (0.05) (0.05) 6.71 51.30 0.82 (0.31) NA 10.68 48.90 0.09 0.17 6.83 191.30 0.80 1.69 16.55 1.17 0.04 6.95 114.61 0.85 0.29 57.30 (0.14) NA 0.05 Exhibit 3 Burton Sensors Consolidated Statement of Cash Flows (Actual/Projected), 2014-2021 (Fiscal years ending December 31; U.S. $000s) 2014A 2015A 2016A 2017E 2018 2019E 2020E 2021E 244.4 98.9 320.0 289.8 55.6 120.3 302 (163.9) (335.5) 260.7 102.9 341.5 423.7 58.3 162.2 72.8 8.8 (216.1) 345.4 122.7 421.3 339.6 60.2 217.7 76.2 45.6 (13.5) 5713 1522 509.6 561.6 89.3 230.6 147.7 121.7 629 686.8 176.6 452.0 479.7 73.8 221.4 1144 62.2 255.9 749.9 208.0 262.2 278.2 42.8 128.4 66.3 33.9 603.4 813.5 2389 2123 2253 34.7 104.0 53.7 34.3 772.0 895.5 253.2 225.1 238.9 36.7 110.2 57.0 44.2 8594 ument is authorized for use only by Reagan Ahlquist in FINA 440 Fall 2021 taught by Ani Mathers, Salisbury Unive Operating Activities Net income Depreciation and amortization Less: increase (decrease) in accounts receivable Less: increase (decrease) in inventory Less: increase (decrease) in other current assets Add: increase (decrease) in accounts payable Add: increase (decrease) in accrued expenses Add: increase (decrease) in deferred taxes Operating activities-net cash flow Investing Activities Less: Capex Investing activities-net cash flow Financing Activities Add: changes in bank borrowings Add: long-term debt net issuance Add: net issuance of common stock Less: cash dividend Financing activities - net cash flow Total net cash flow Beginning cash Change in cash Ending cash (354.9) (354.9) (522.2) (522.2) (483.5) (483.5) (345.9) (345.9) (267.5) (267.5) (144.5) (144.5) (153.1) (153.1) (162.3) (162.3) 150.0 (150.0) 800.0 (150.0) 0.0 0.0 650.0 860.0 (150.0) 0.0 0.0 710.0 700.0 (150.0) 0.0 0.0 550.0 500.0 (150.0) 0.0 0.0 3500 0.0 (300.0) (150.0) 0.0 0.0 (450.0) (400.0) (150.0) 0.0 0.0 (550.0) (500.0) (150.0) 0.0 0.0 (650.0) 0.0 0.0 (40.3) (28.4) 53.0 67.0 (11.6) 8.9 68.9 47.1 320.0 (40.3) 279.7 279.7 (28.4) 251.3 251.3 53.0 304.3 3043 67.0 3713 371.3 (11.6) 359.7 359.7 8.9 368.6 368.6 68.9 4375 437.5 47.1 484.6 Exhibit 5 Electro-Engineering Consolidated Balance Sheets, 2014-2016 (Fiscal years ending December 31; U.S. $000s) 2014 2015 2016 379.1 485.9 279.8 27.8 1,172.5 350.2 592.0 413.7 5.2 1,361.1 359.8 680.1 480.6 16.9 1,537.4 Cash and equivalents Accounts receivable Inventory Prepaid expenses Current assets Net PP&E Total assets Bank loans Accounts payable Accrued expenses Total liabilities Shareholders' equity Total liabilities and equity 249.1 1,421.6 339.3 1,700.3 479.8 2,017.1 340.6 126.6 104.9 572.1 340.6 1534 77.0 570.9 310.6 175.1 101.8 587.5 849.5 1,421.6 1,129.4 1,700.3 1,429.6 2,017.1 Exhibit 6 Electro-Engineering Consolidated Income Statements, 2014-2016 (Fiscal years ending December 31; U.S. $000s) 2014 2015 2016 Net sales COGS Gross profit SG&A expense R&D expense Depreciation and amortization Interest expense Pretax income (loss) 2,944.9 1,525.0 1,420.0 814.9 153.1 142.2 18.7 291.0 3,566.3 1,811.7 1,754.6 930.1 178.3 196.9 18.7 430,6 4,072.7 2.085.2 1,987.5 1,080.9 219.9 206.1 18.7 461.8 101.8 189.1 150.7 279.9 161.6 300.2 Income taxes Net income Number of common shares (thousands) Earnings per share Cash dividend per share 1,100 0.17 0.0 1,100 0.25 0.0 1,100 0.27 0.0 Exhibit 1 Burton Sensors Consolidated Balance Sheets (Actual/Projected), 2014-2021 (Fiscal years ending December 31; U.S. S000s) 2014A 2015A 2016A 2017E 2018E 2019E 2020E 2021E Cash and equivalents Accounts receivable Inventory Other current assets Current assets 279.7 251.3 1,5525 1,894.0 1,672.9 2,096.7 253.5 311.8 3,758.6 4,553.8 304.3 2,315.4 2,436.3 371.9 5,427.8 4,654.1 10,082.0 3,874.0 4,2933 7,6326 8,817.2 This document is authorized for use only by Reagan Ahlquist in FINA 440 Fall 2021 taught by Ani Mothers, Salisbury - Net PP&E Total assets Accounts payable Accrued expenses Bank loans Deferred taxes Long-term debt, current portion Current Liabilities Long-term debt Total liabilities Shareholders' equity Total liabilities and equity 371.3 359.7 368.6 437-5 484.6 2,824.9 3,276.9 3,539.1 3,751.4 3,9765 (24.5% of projected sales) 2.997.9 3,477.6 3,755.8 3,981.1 4,220.0 (26% of projected sales) 461.2 535.0 577.8 6125 649.2 (4% of projected sales) 6,655.3 7,6492 8,241.3 8,7825 9,3303 4,847.8 4,938.8 4,875 2 4.789.5 4,698.6 11,503.2 12,588.0 13,116.5 13,572.0 14,028.9 1,383.6 1,605.0 1,733.4 1,837.4 1,9477 (12% of projected sales) 714.9 829.3 895.6 949.3 1,0063 (6.2% of projected sales) 5,080.0 5,230.0 4,930.0 4,530,0 4,030.0 527.9 590.1 624.0 658.3 7025 150.0 150.0 150.0 150.0 150.0 7,856.4 8,404.4 8,333.1 8,125.1 7,836.5 773.1 935.3 4182 491.0 3,020.0 3,880.0 351.9 360.7 150.0 150.0 4,713.2 5,817.0 1,153.0 567.2 4,580.0 406.2 150.0 6,856,5 1,980.0 1,830.0 6,693.2 7,647.0 1,680.0 8,536.5 1,530.0 9,386.4 1380.0 9,784.4 1,230.0 9,563.1 1,080.0 9,205.1 930.0 8,766,5 939.4 1,200.1 7,6326 8.847.2 1,545.5 10,082.0 2,116.8 2.803.6 3,553.4 4,366.9 5,262.4 11,503.2 12,588.0 13,116.5 13,572.0 14,028.9 0.87 Bank loan/(receivables + inventory) Liabilities/book equity Total interest-bearing debt/book equity 0.94 7.1x 5.5x 0.97 6.4x 4.9x 0.96 5.5x 4.1x 0.77 3.5x 2.4x 0.68 2.7x 1.8% 0.59 2.1x 1.3x 0.49 1.7x 1.Ox 3.2x Exhibit 4 Comparative Data for Four Publicly Traded Sensor Manufacturers, 20142016 (SU.S. millions) 2014 Opsens (OPS) 2015 Cyberoptics (CYBE) 2014 2015 2016 2016 17.75 41.13 (2.20) (2.10) 44.74 66.24 6.15 11.56 59.58 53.33 1.02 2.00 59.50 This document is authorized for use only by Reagan Ahlquist in FINA 440 Fall 2021 taught by 8.68 TE Connectivity (TEL) 2014 2015 2016 Net sales 12,233.00 12,238.00 13,113.00 Operating profit 1,992.00 1,936.00 2,201.00 Net income 2,420.00 2,009.00 1.683.00 Assets 20,589.00 17,608.00 19,403.00 Total debt 3,884.00 4,070.00 4,344.00 Total liabilities 11,004,00 9,123.00 9,652.00 Shareholders' equity 9,585.00 8,485.00 9,751.00 Operating margin 0.16 0.16 0.17 Profit margin 0.20 0.16 0.13 Shares outstanding 405.00 366.00 355.00 Market capitalization 24,959.14 24,618.77 33,490.92 Equity beta* 1.30 1.26 1.24 EPS 5.98 5.49 4.74 P/E 10.31 12.25 19.90 D/Marketcap 0.16 0.17 0.13 Based on previous five years. Ametek (AME) 2014 2015 2016 3,974.30 3,840.09 4,300.17 944.32 841.40 931.89 590.86 512.16 681.47 6,660.45 7,100.67 7,796.06 1,866.12 2,062.64 1.866.17 3,405.82 3,844.16 3,768.43 3,254.63 3,256.51 4,027.63 0.24 0.22 0.22 0.15 0.13 0.16 239.91 232.59 230.23 12,748.27 15,280.00 16,940.38 1.29 1.16 1.25 2.46 2.20 2.96 21.58 29.83 24.86 0.15 0.13 0.11 9.60 (8.49) (9.28) 16.86 5.58 9.55 7.31 (0.88) (0.97) 66.74 108.11 7.22 52.28 5.21 (5.13) (2.88) 12.76 3.69 6.87 5.89 (0.99) (0.55) 60.18 51.75 1.32 (0.05) NA 0.07 0.02 (6.54) 27.61 5.30 9.64 17.97 (0.36) (0.37) 80.95 90.67 1.02 (0.08) NA 0.06 36.06 (0.05) (0.05) 6.71 51.30 0.82 (0.31) NA 10.68 48.90 0.09 0.17 6.83 191.30 0.80 1.69 16.55 1.17 0.04 6.95 114.61 0.85 0.29 57.30 (0.14) NA 0.05 Exhibit 3 Burton Sensors Consolidated Statement of Cash Flows (Actual/Projected), 2014-2021 (Fiscal years ending December 31; U.S. $000s) 2014A 2015A 2016A 2017E 2018 2019E 2020E 2021E 244.4 98.9 320.0 289.8 55.6 120.3 302 (163.9) (335.5) 260.7 102.9 341.5 423.7 58.3 162.2 72.8 8.8 (216.1) 345.4 122.7 421.3 339.6 60.2 217.7 76.2 45.6 (13.5) 5713 1522 509.6 561.6 89.3 230.6 147.7 121.7 629 686.8 176.6 452.0 479.7 73.8 221.4 1144 62.2 255.9 749.9 208.0 262.2 278.2 42.8 128.4 66.3 33.9 603.4 813.5 2389 2123 2253 34.7 104.0 53.7 34.3 772.0 895.5 253.2 225.1 238.9 36.7 110.2 57.0 44.2 8594 ument is authorized for use only by Reagan Ahlquist in FINA 440 Fall 2021 taught by Ani Mathers, Salisbury Unive Operating Activities Net income Depreciation and amortization Less: increase (decrease) in accounts receivable Less: increase (decrease) in inventory Less: increase (decrease) in other current assets Add: increase (decrease) in accounts payable Add: increase (decrease) in accrued expenses Add: increase (decrease) in deferred taxes Operating activities-net cash flow Investing Activities Less: Capex Investing activities-net cash flow Financing Activities Add: changes in bank borrowings Add: long-term debt net issuance Add: net issuance of common stock Less: cash dividend Financing activities - net cash flow Total net cash flow Beginning cash Change in cash Ending cash (354.9) (354.9) (522.2) (522.2) (483.5) (483.5) (345.9) (345.9) (267.5) (267.5) (144.5) (144.5) (153.1) (153.1) (162.3) (162.3) 150.0 (150.0) 800.0 (150.0) 0.0 0.0 650.0 860.0 (150.0) 0.0 0.0 710.0 700.0 (150.0) 0.0 0.0 550.0 500.0 (150.0) 0.0 0.0 3500 0.0 (300.0) (150.0) 0.0 0.0 (450.0) (400.0) (150.0) 0.0 0.0 (550.0) (500.0) (150.0) 0.0 0.0 (650.0) 0.0 0.0 (40.3) (28.4) 53.0 67.0 (11.6) 8.9 68.9 47.1 320.0 (40.3) 279.7 279.7 (28.4) 251.3 251.3 53.0 304.3 3043 67.0 3713 371.3 (11.6) 359.7 359.7 8.9 368.6 368.6 68.9 4375 437.5 47.1 484.6 Exhibit 5 Electro-Engineering Consolidated Balance Sheets, 2014-2016 (Fiscal years ending December 31; U.S. $000s) 2014 2015 2016 379.1 485.9 279.8 27.8 1,172.5 350.2 592.0 413.7 5.2 1,361.1 359.8 680.1 480.6 16.9 1,537.4 Cash and equivalents Accounts receivable Inventory Prepaid expenses Current assets Net PP&E Total assets Bank loans Accounts payable Accrued expenses Total liabilities Shareholders' equity Total liabilities and equity 249.1 1,421.6 339.3 1,700.3 479.8 2,017.1 340.6 126.6 104.9 572.1 340.6 1534 77.0 570.9 310.6 175.1 101.8 587.5 849.5 1,421.6 1,129.4 1,700.3 1,429.6 2,017.1 Exhibit 6 Electro-Engineering Consolidated Income Statements, 2014-2016 (Fiscal years ending December 31; U.S. $000s) 2014 2015 2016 Net sales COGS Gross profit SG&A expense R&D expense Depreciation and amortization Interest expense Pretax income (loss) 2,944.9 1,525.0 1,420.0 814.9 153.1 142.2 18.7 291.0 3,566.3 1,811.7 1,754.6 930.1 178.3 196.9 18.7 430,6 4,072.7 2.085.2 1,987.5 1,080.9 219.9 206.1 18.7 461.8 101.8 189.1 150.7 279.9 161.6 300.2 Income taxes Net income Number of common shares (thousands) Earnings per share Cash dividend per share 1,100 0.17 0.0 1,100 0.25 0.0 1,100 0.27 0.0Step by Step Solution
There are 3 Steps involved in it
Step: 1

Get Instant Access to Expert-Tailored Solutions
See step-by-step solutions with expert insights and AI powered tools for academic success
Step: 2

Step: 3

Ace Your Homework with AI
Get the answers you need in no time with our AI-driven, step-by-step assistance
Get Started


