

Question
You should create a program in Matlab that allows long-term monitoring of the plant soil to ensure that the plant receives water as it needs
You should create a program in Matlab that allows long-term monitoring of the plant soil to ensure that the plant receives water as it needs it. That means measuring the soil moisture using a soil moisture sensor attached to your Arduino or Grove board. When the soil is dry, have a MOSFET or Relay board turn a water pump on to deliver water to the soil, turning off the pump when there is enough water in the soil. Then wait until the soil is dry again and start the process over again.
So that sums up what I have to do. I'm using a Grove Beginner Kit and MATLAB for this. In addition, I have to make a graph of the moisture over time.
My code so far is as follows:
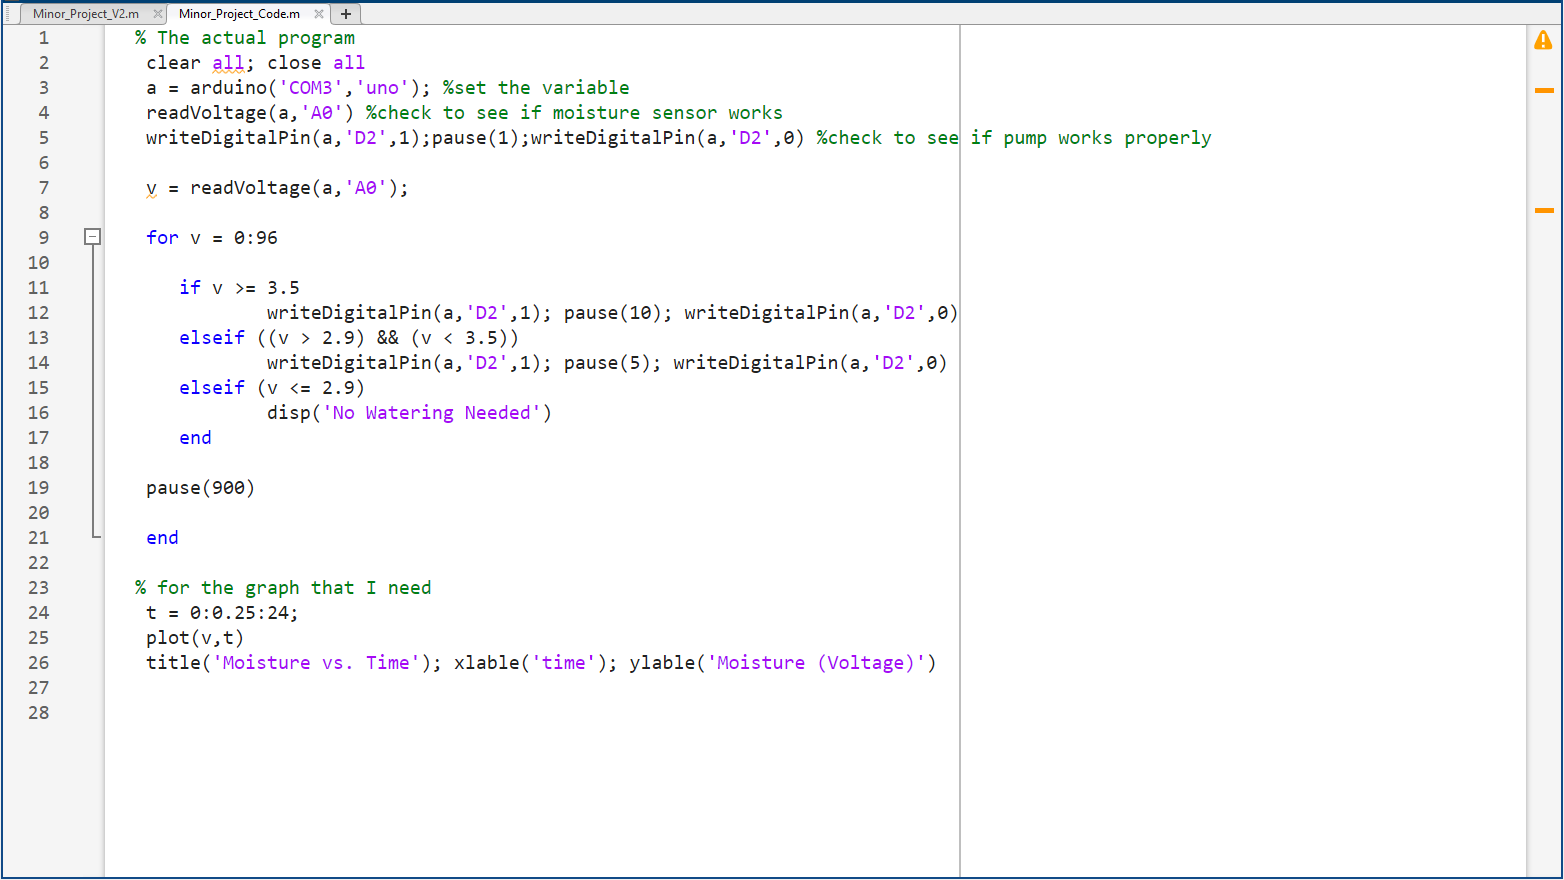 What I'm struggling with is the graph I have to make. I know this code is very basic and the graphing part is completely wrong, but I honestly have no clue where to start with the graphing part. If you need any more context ask and you shall recieve.
Step by Step Solution
There are 3 Steps involved in it
Step: 1

Get Instant Access to Expert-Tailored Solutions
See step-by-step solutions with expert insights and AI powered tools for academic success
Step: 2

Step: 3
Ace Your Homework with AI
Get the answers you need in no time with our AI-driven, step-by-step assistance
Get Started
Essentials of Database Management
Authors: Jeffrey A. Hoffer, Heikki Topi, Ramesh Venkataraman
1st edition
133405680, 9780133547702 , 978-0133405682