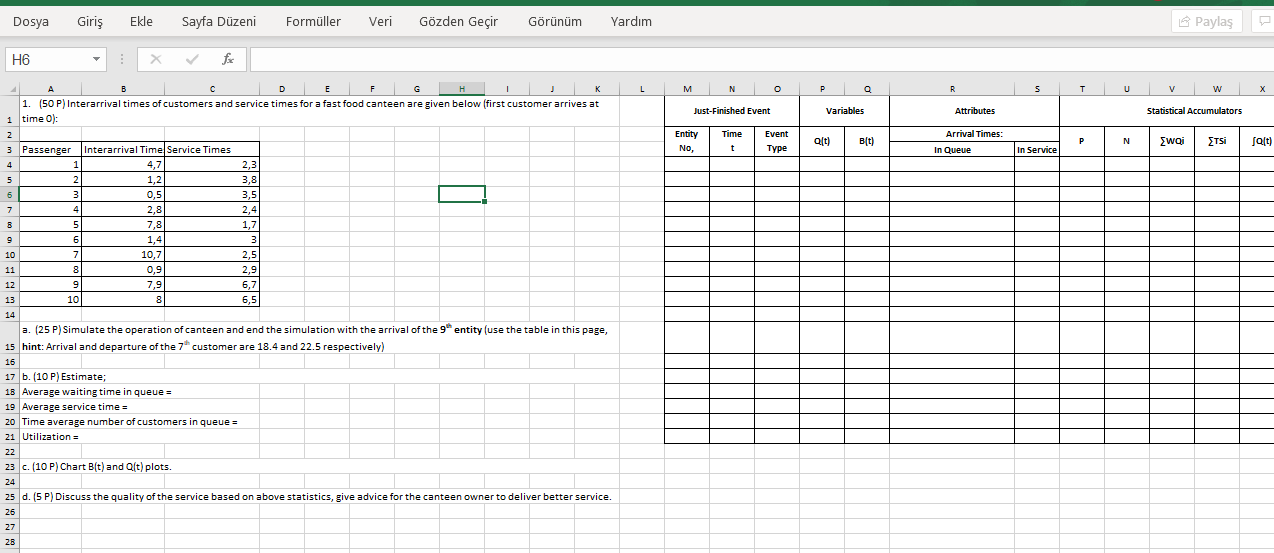
YOU SHOULD DO HAND SIMULATION 
Dosya Giri Ekle Sayfa Dzeni Formller Veri Gzden Geir Grnm Yardm Payla H6 for L M N o P R 5 T U U V w X Just-Finished Event Variables Attributes Statistical Accumulators Entity Time Arrival Times: Event Type alt) Bit) P N swoi Tsi so(t) No, t In Queue In Service 1 2 A E F G 1. (50 P) Interarrival times of customers and service times for a fast food canteen are given below (first customer arrives at 1 time 0): 2 3 Passenger Interarrival Time Service Times 4 4,7 2,3 5 1,2 3,8 3 0,5 3,5 4 2,8 2,4 B 5 7,8 1,7 9 6 1,4 3 10 7 10,7 2,5 11 8 2,9 12 9 7,9 6,7 13 10 8 6,5 6 - 7 0,9 14 a. (25P)Simulate the operation of canteen and end the simulation with the arrival of the 9 entity (use the table in this page, 15 hint: Arrival and departure of the 7* customer are 18.4 and 22.5 respectively) 16 17 b. (10 P) Estimate; 18 Average waiting time in queue = 19 Average service time = 20 Time average number of customers in queue = 21 Utilization = 22 23 c. (10 P) Chart B(t) and Qlt) plots. 24 25 d. (5P) Discuss the quality of the service based on above statistics, give advice for the canteen owner to deliver better service. 26 27 2B Dosya Giri Ekle Sayfa Dzeni Formller Veri Gzden Geir Grnm Yardm Payla H6 for L M N o P R 5 T U U V w X Just-Finished Event Variables Attributes Statistical Accumulators Entity Time Arrival Times: Event Type alt) Bit) P N swoi Tsi so(t) No, t In Queue In Service 1 2 A E F G 1. (50 P) Interarrival times of customers and service times for a fast food canteen are given below (first customer arrives at 1 time 0): 2 3 Passenger Interarrival Time Service Times 4 4,7 2,3 5 1,2 3,8 3 0,5 3,5 4 2,8 2,4 B 5 7,8 1,7 9 6 1,4 3 10 7 10,7 2,5 11 8 2,9 12 9 7,9 6,7 13 10 8 6,5 6 - 7 0,9 14 a. (25P)Simulate the operation of canteen and end the simulation with the arrival of the 9 entity (use the table in this page, 15 hint: Arrival and departure of the 7* customer are 18.4 and 22.5 respectively) 16 17 b. (10 P) Estimate; 18 Average waiting time in queue = 19 Average service time = 20 Time average number of customers in queue = 21 Utilization = 22 23 c. (10 P) Chart B(t) and Qlt) plots. 24 25 d. (5P) Discuss the quality of the service based on above statistics, give advice for the canteen owner to deliver better service. 26 27 2B


