Question
You want to analyze the locations of 12 stores in a region. The region has been divided into 72 zones in an 8-by-9 grid. Each
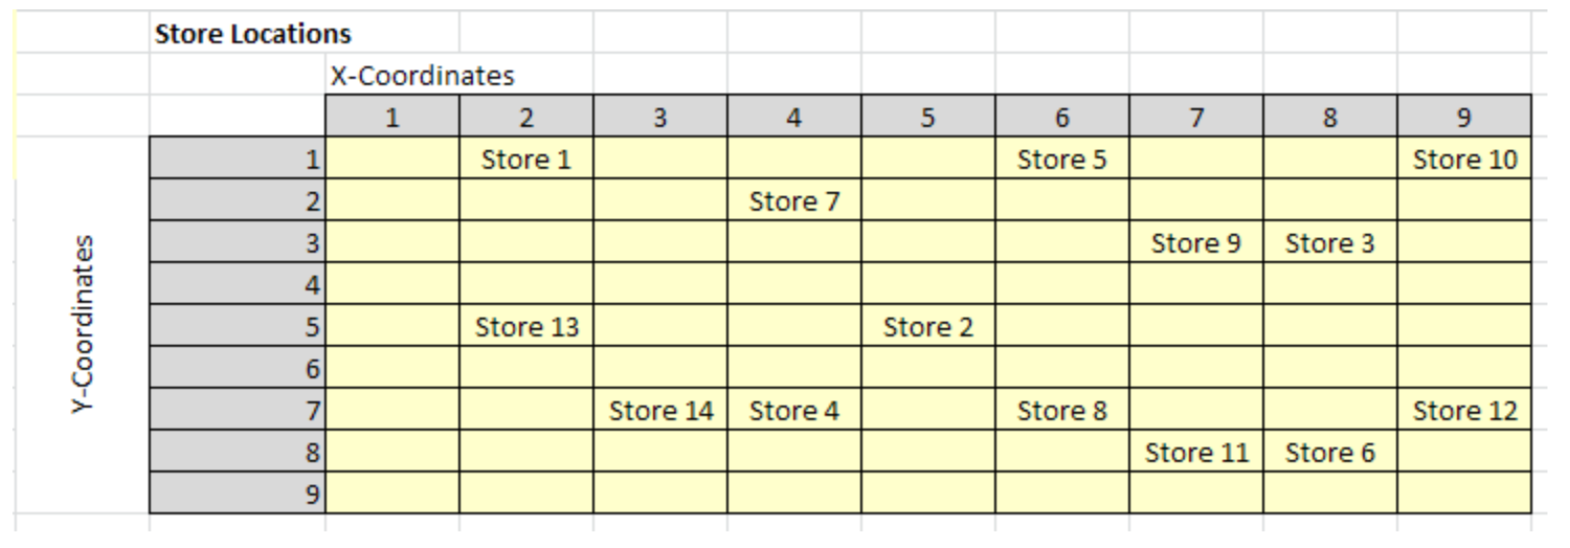
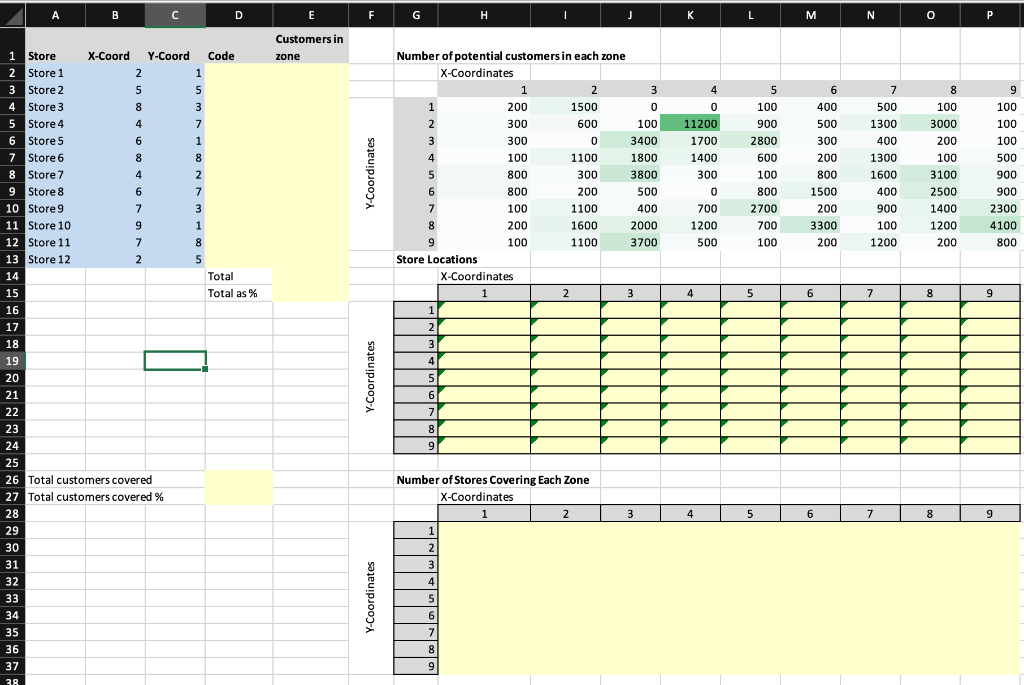
You want to analyze the locations of 12 stores in a region. The region has been divided into 72 zones in an 8-by-9 grid. Each grid has a certain number of potential customers who could shop in the store of that zone. The cells of the table that contains this data has been colored by color scales of Excels Conditional Formatting tool (the darker the shade of green the larger the number of potential customers in that zone). You have a list of the stores with their coordinates (in range A1:C15) and you would like to visualize the locations of these stores in the grid. To this end: a) In the column titled Code get a code that is obtained by concatenating the x- coordinate and y-coordinate of each store. Hint: You can use the operator & to join or concatenate the contents of two cells into single text. So, for example, the formula =B2&C2 will create a text that joins the contents of these cells. b) In the column titled Customers in zone, find the number of customers in the zone of that store. Hint: Use INDEX. c) Calculate the total number of customers covered by the stores in cell E14 and in cell E15 calculate the value you have calculated in E14 as percent of the total number of potential customers in all zones in the region. d) In the matrix titled Store Locations you want to see the location of each store as shown in the screen shot below. (Hint: You can use MATCH, INDEX and IFERROR functions). For the rest of the question, assume that a store in a location can cover its own region and its adjacent neighbors. So for instance Store 7 can cover the customers in zones with (x,y) coordinates (3,1), (3,2), (3,3), (4,1),(4,2), (4,3), (5,1), (5,2), and (5,3).

e) In the table titled Number of Stores Covering Each Zone you should calculate for each zone the number of stores that have that zone as their adjacent neighbors. For instance, zone in coordinates (3,1) is covered by Store 1 and Store 7, so your formula should return 2. To do this you will need to use two functions: COUNTIF and OFFSET. Hint 1: When entering the condition for the COUNTIF (or any conditional function for that matter), you can use the wildcard character * to create a condition that looks for any string that starts with St by writing COUNTIF(a range reference, St*). This means Excel will count the number of cells that have a text content that start with St. In general, you can use * to stand for any character. Another example would be *re* represents all text that contains re. Hint 2: You will use OFFSET to return a range reference (address) in which COUNTIF will look for St*. f) In the table titled Store Locations use conditional formatting so that zones (cells) covered by at least 1 store have a green fill-color, whereas others are left without as they are. Note that the conditional formatting here will be using information in the table titled Number of Stores Covering Each Zone. g) In cell D26 calculate the total customers covered note that customers in a zone are covered if that zone is covered by at least one store. Hint: You will use SUMIF h) In cell D27 calculate the value you have found in cell D26 as a percent of total number of customers.

Step by Step Solution
There are 3 Steps involved in it
Step: 1

Get Instant Access to Expert-Tailored Solutions
See step-by-step solutions with expert insights and AI powered tools for academic success
Step: 2

Step: 3

Ace Your Homework with AI
Get the answers you need in no time with our AI-driven, step-by-step assistance
Get Started


