

Answered step by step
Verified Expert Solution
Question
1 Approved Answer
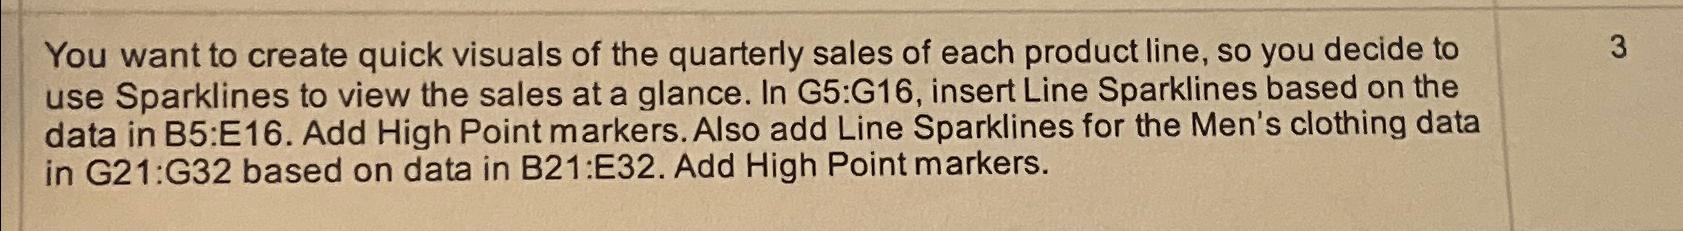
You want to create quick visuals of the quarterly sales of each product line, so you decide to use Sparklines to view the sales at
You want to create quick visuals of the quarterly sales of each product line, so you decide to use Sparklines to view the sales at a glance. In G:G insert Line Sparklines based on the data in B:E Add High Point markers. Also add Line Sparklines for the Men's clothing data in G:G based on data in B:E Add High Point markers.
Step by Step Solution
There are 3 Steps involved in it
Step: 1

Get Instant Access to Expert-Tailored Solutions
See step-by-step solutions with expert insights and AI powered tools for academic success
Step: 2

Step: 3
Ace Your Homework with AI
Get the answers you need in no time with our AI-driven, step-by-step assistance
Get Started
Excel As Your Database
Authors: Paul Cornell
1st Edition
1590597516, 978-1590597514