Answered step by step
Verified Expert Solution
Question
1 Approved Answer
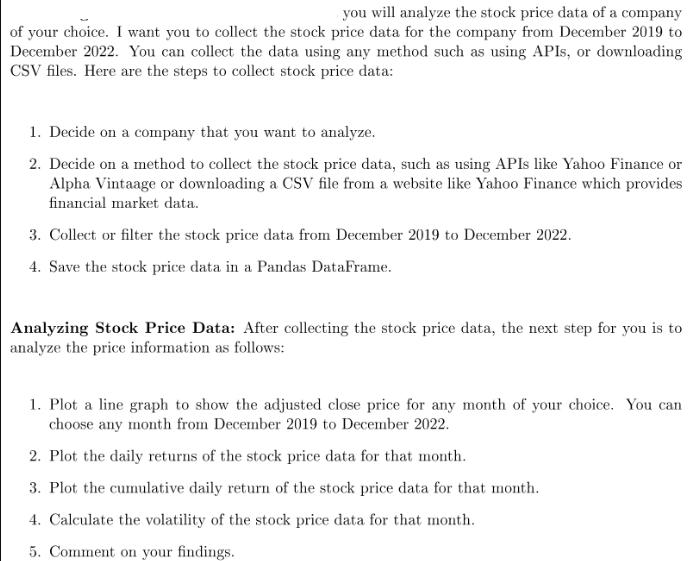
you will analyze the stock price data of a company of your choice. I want you to collect the stock price data for the


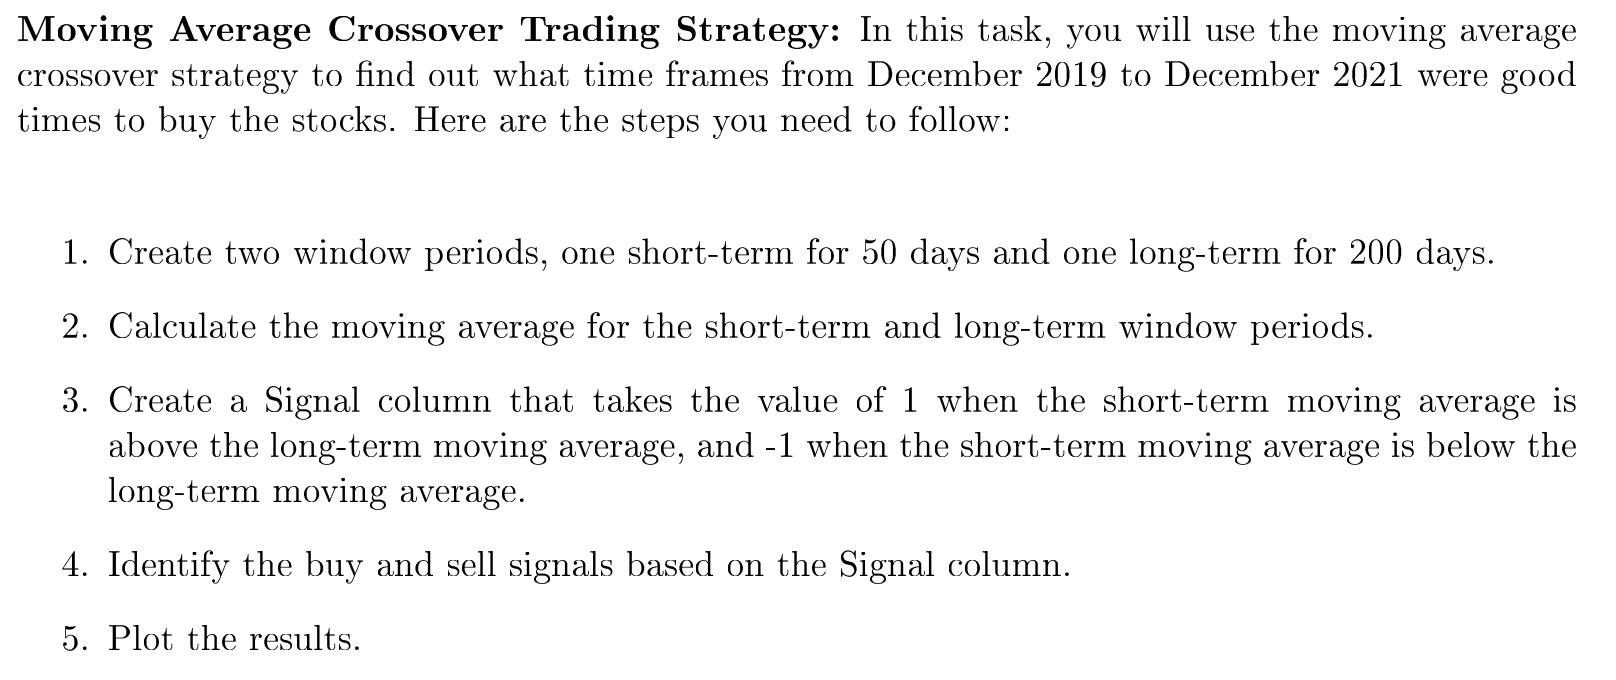
you will analyze the stock price data of a company of your choice. I want you to collect the stock price data for the company from December 2019 to December 2022. You can collect the data using any method such as using APIs, or downloading CSV files. Here are the steps to collect stock price data: 1. Decide on a company that you want to analyze. 2. Decide on a method to collect the stock price data, such as using APIs like Yahoo Finance or Alpha Vintaage or downloading a CSV file from a website like Yahoo Finance which provides financial market data. 3. Collect or filter the stock price data from December 2019 to December 2022. 4. Save the stock price data in a Pandas DataFrame. Analyzing Stock Price Data: After collecting the stock price data, the next step for you is to analyze the price information as follows: 1. Plot a line graph to show the adjusted close price for any month of your choice. You can choose any month from December 2019 to December 2022. 2. Plot the daily returns of the stock price data for that month. 3. Plot the cumulative daily return of the stock price data for that month. 4. Calculate the volatility of the stock price data for that month. 5. Comment on your findings. Moving Average Crossover Trading Strategy: In this task, you will use the moving average crossover strategy to find out what time frames from December 2019 to December 2021 were good times to buy the stocks. Here are the steps you need to follow: 1. Create two window periods, one short-term for 50 days and one long-term for 200 days. 2. Calculate the moving average for the short-term and long-term window periods. 3. Create a Signal column that takes the value of 1 when the short-term moving average is above the long-term moving average, and -1 when the short-term moving average is below the long-term moving average. 4. Identify the buy and sell signals based on the Signal column. 5. Plot the results.
Step by Step Solution
★★★★★
3.44 Rating (154 Votes )
There are 3 Steps involved in it
Step: 1
sent to directly apply the moving average crossover strategy but I can explain the steps involved to get you started The moving average crossover stra...
Get Instant Access to Expert-Tailored Solutions
See step-by-step solutions with expert insights and AI powered tools for academic success
Step: 2

Step: 3

Ace Your Homework with AI
Get the answers you need in no time with our AI-driven, step-by-step assistance
Get Started


