You will be analyzing the following firms:
a. Pfizer
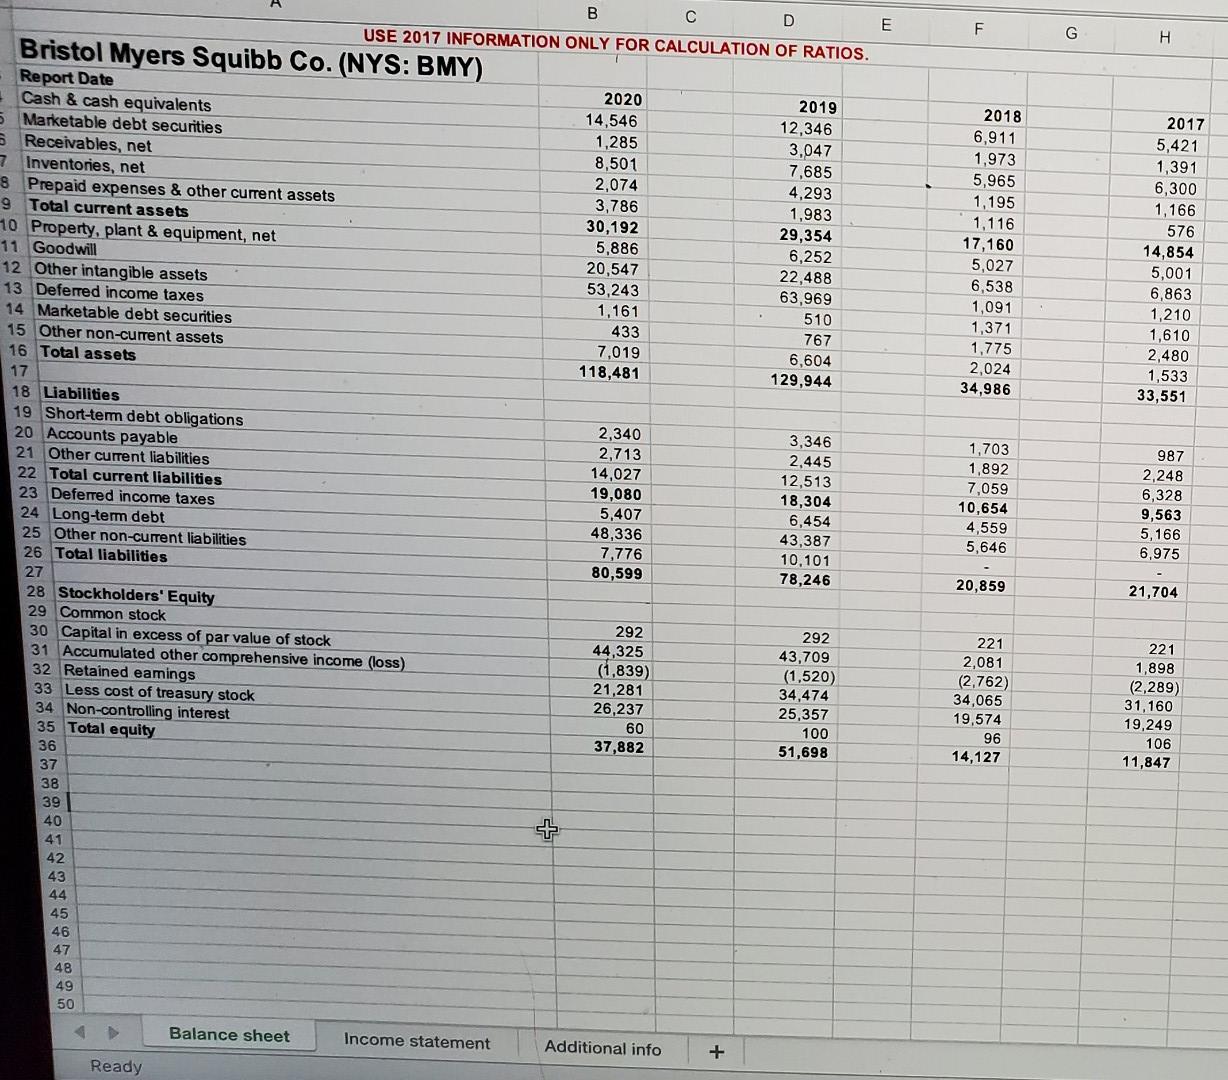
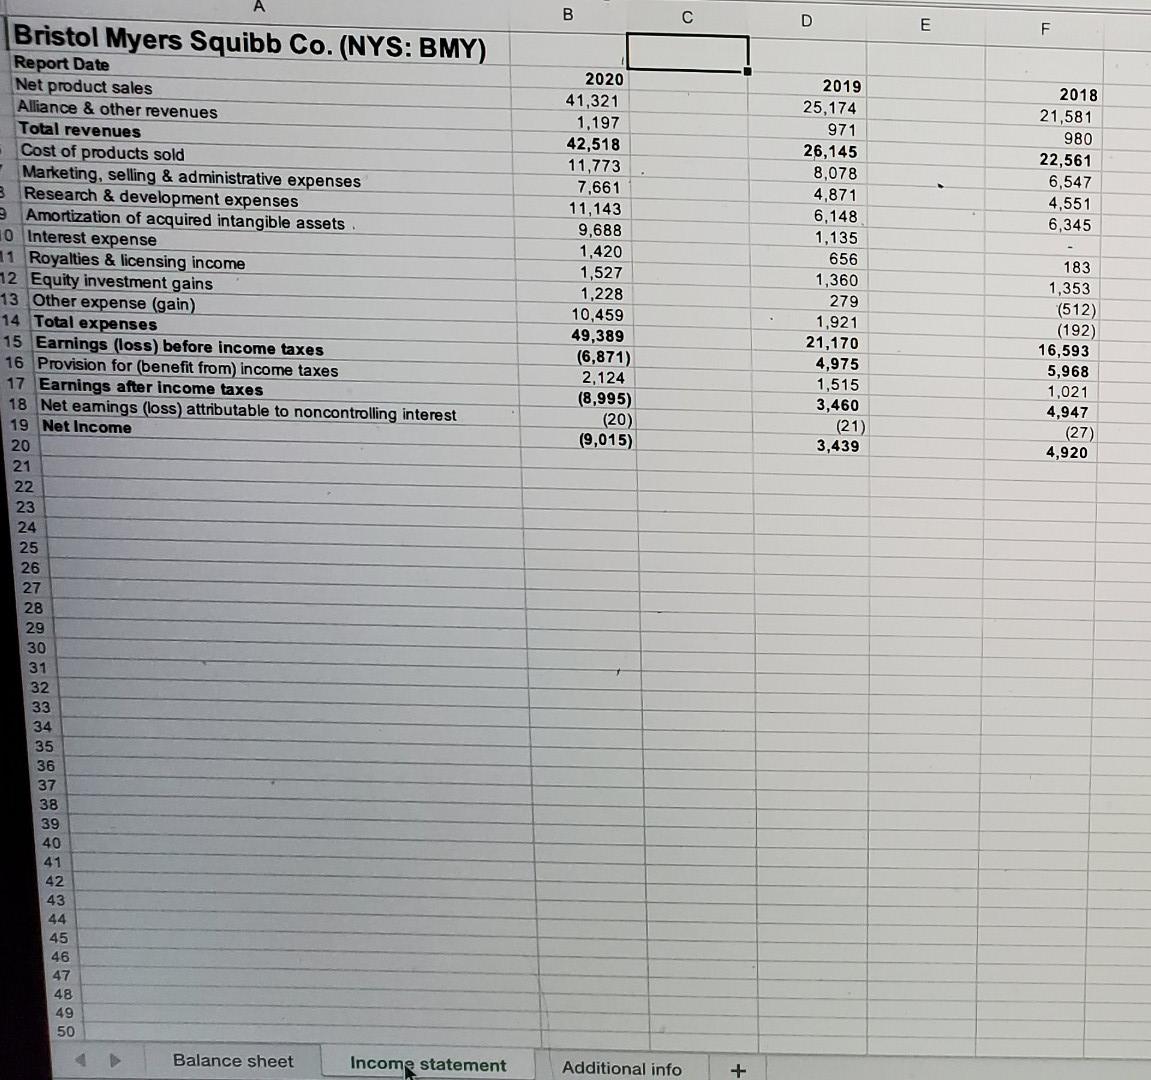
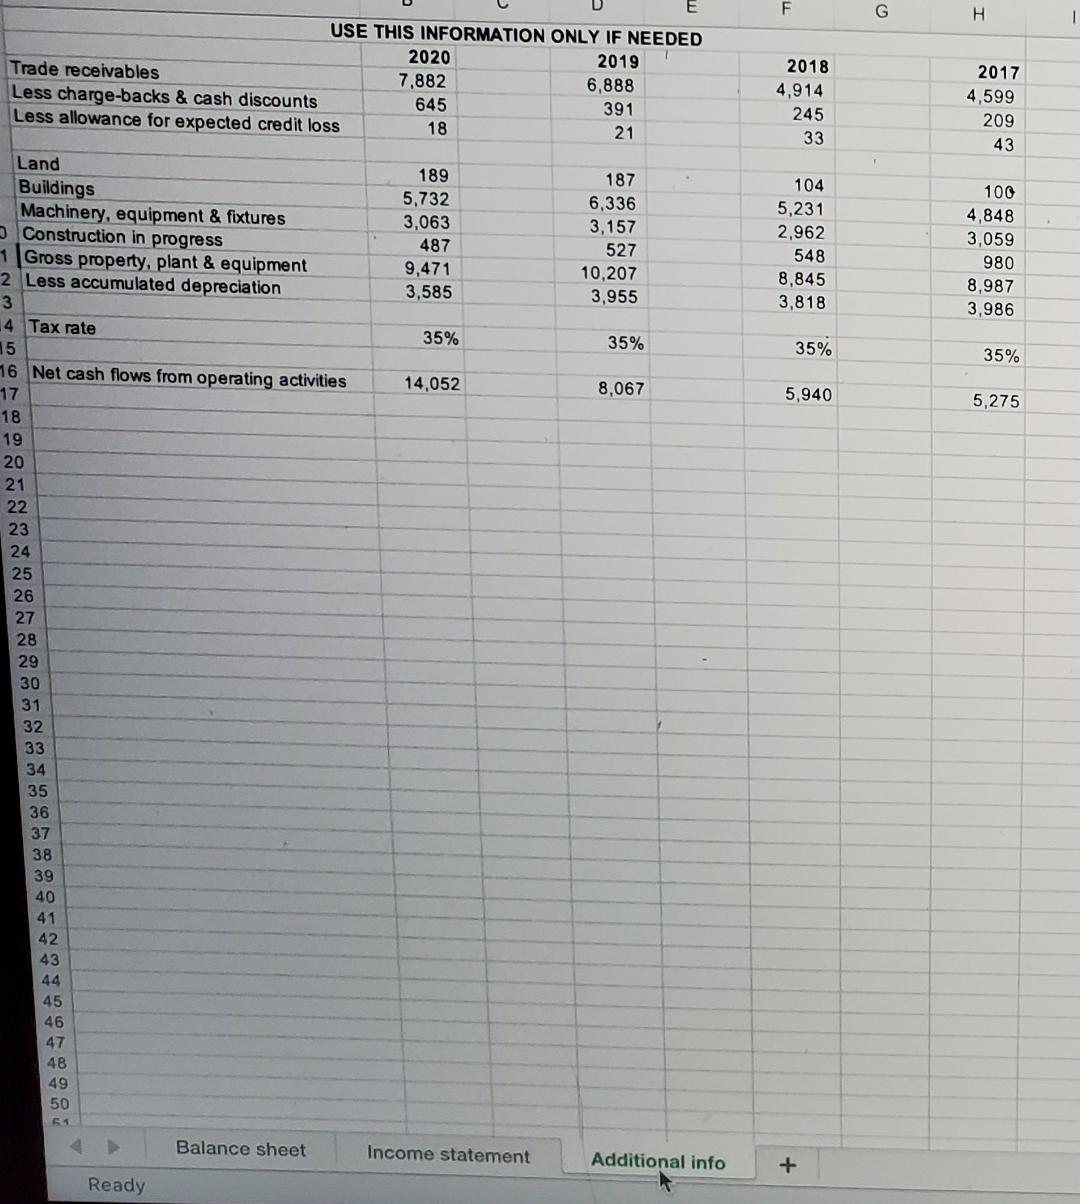
b. Bristol Myers Squibb
Please check the blackboard for the financial statements.
The required tasks are detailed below:
1. Prepare vertical common-size income statements and balance sheets for both companies. Note: Use Net Sales and Total Assets as the denominators for income statement and balance sheet, respectively. Compute for 2020, 2019, and 2018.
2. Prepare horizontal analysis on income statements and balance sheets for both companies for 2020 and 2019.
3. Prepare ratio analyses (for 2020, 2019, and 2018) for both companies. You should include the following ratios in your computations:
Profitability ratios
o Gross Profit margin
o Profit margin
o Return on assets
o Return on equity
Productivity
o Inventory Turnover
o Accounts Receivable Turnover
o PPE Turnover
o Asset Turnover
Solvency
o Debt-to-equity
o Times interest earned
o Financial leverage
Liquidity
o Current Ratio
o Quick Ratio
o Working capital
4. Answer the following questions:
1)Which company is attractive to stockholders? Support your answer by discussing the analyses performed above.
2)Which company is attractive to the creditors? Support your answer by discussing the analyses performed above.
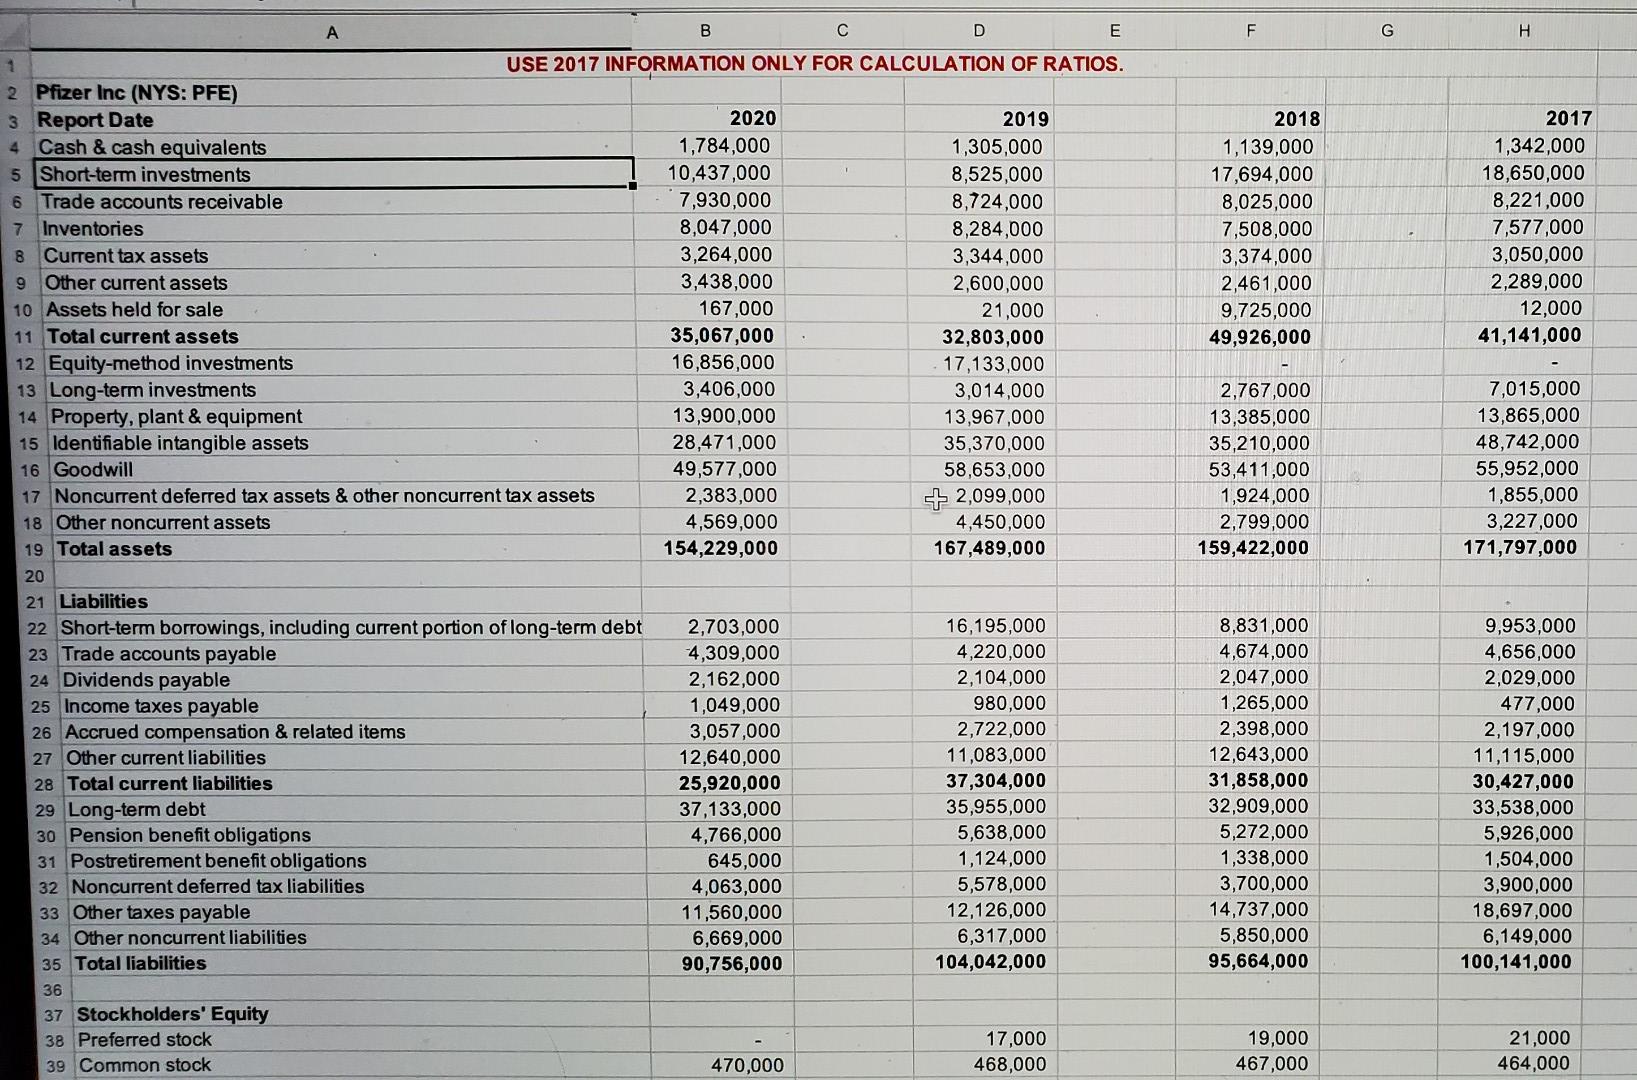
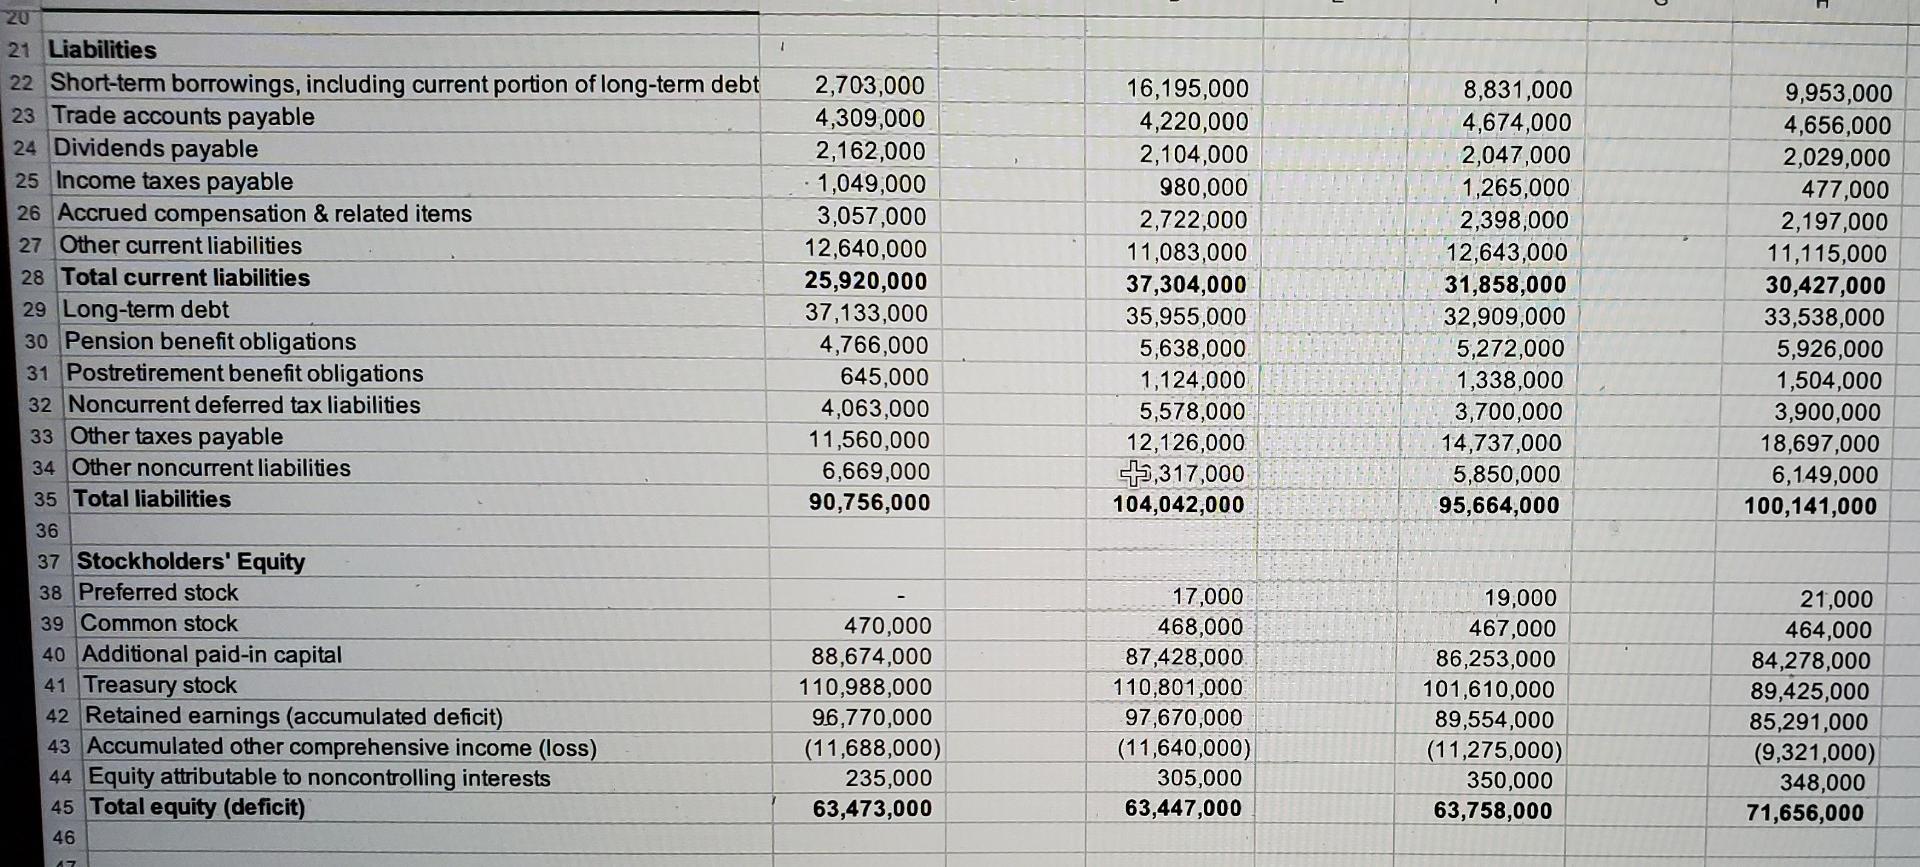
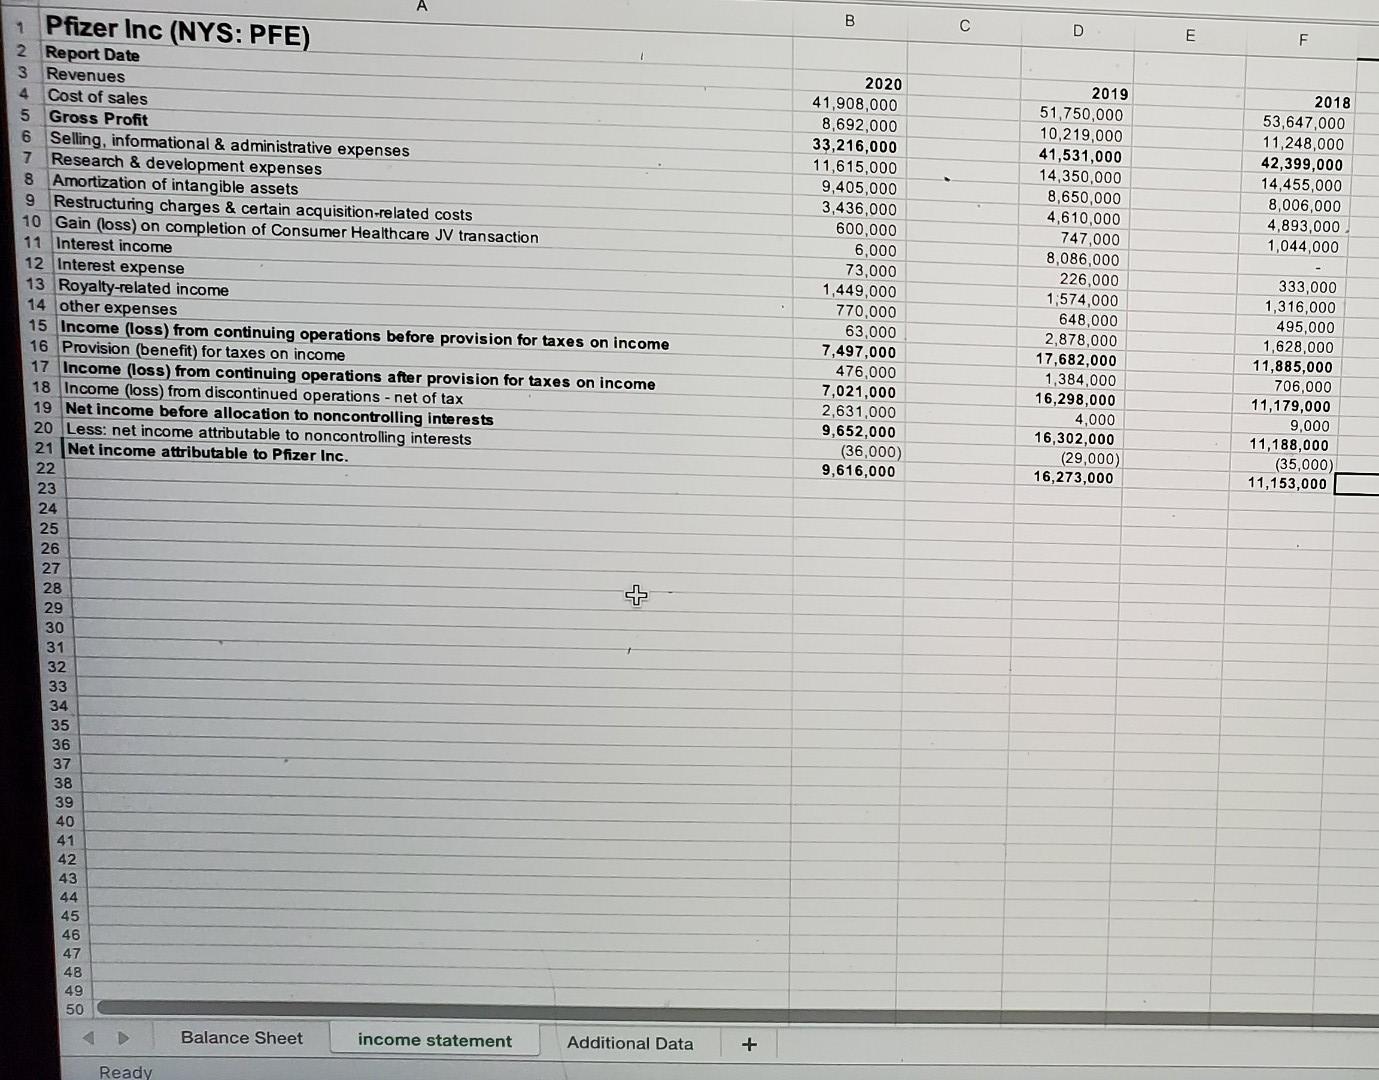
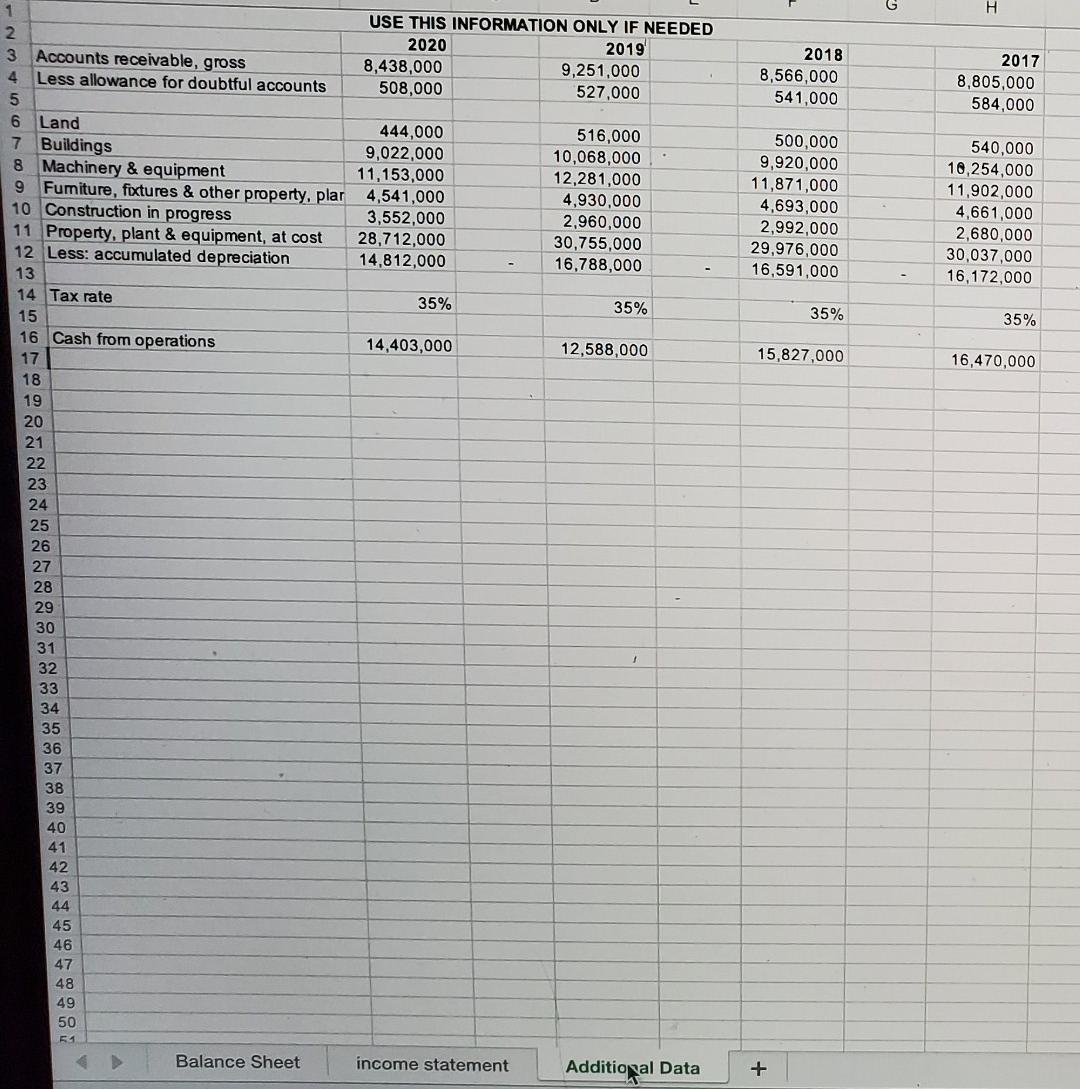
A B C D E USE 2017 INFORMATION ONLY FOR CALCULATION OF RATIOS. 2020 1,784,000 10,437,000 2019 1,305,000 8,525,000 7,930,000 8,724,000 8,047,000 8,284,000 3,264,000 3,344,000 3,438,000 2,600,000 167,000 21,000 35,067,000 32,803,000 16,856,000 17,133,000 3,406,000 3,014,000 13,900,000 13,967,000 35,370,000 28,471,000 49,577,000 58,653,000 2,383,000 +2,099,000 4,569,000 4,450,000 154,229,000 167,489,000 2,703,000 16,195,000 4,309,000 4,220,000 2,162,000 2,104,000 1,049,000 980,000 3,057,000 2,722,000 12,640,000 11,083,000 25,920,000 37,304,000 37,133,000 35,955,000 4,766,000 5,638,000 645,000 1,124,000 4,063,000 5,578,000 11,560,000 12,126,000 6,669,000 6,317,000 90,756,000 104,042,000 17,000 470,000 468,000 1 2 Pfizer Inc (NYS: PFE) 3 Report Date 4 Cash & cash equivalents 5 Short-term investments 6 Trade accounts receivable 7 Inventories 8 Current tax assets 9 Other current assets 10 Assets held for sale 11 Total current assets 12 Equity-method investments 13 Long-term investments 14 Property, plant & equipment 15 Identifiable intangible assets 16 Goodwill 17 Noncurrent deferred tax assets & other noncurrent tax assets 18 Other noncurrent assets 19 Total assets 20 21 Liabilities 22 Short-term borrowings, including current portion of long-term debt 23 Trade accounts payable 24 Dividends payable 25 Income taxes payable 26 Accrued compensation & related items 27 Other current liabilities 28 Total current liabilities 29 Long-term debt 30 Pension benefit obligations 31 Postretirement benefit obligations 32 Noncurrent deferred tax liabilities 33 Other taxes payable 34 Other noncurrent liabilities 35 Total liabilities 36 37 Stockholders' Equity 38 Preferred stock 39 Common stock F 2018 1,139,000 17,694,000 8,025,000 7,508,000 3,374,000 2,461,000 9,725,000 49,926,000 2,767,000 13,385,000 35,210,000 53,411,000 1,924,000 2,799,000 159,422,000 8,831,000 4,674,000 2,047,000 1,265,000 2,398,000 12,643,000 31,858,000 32,909,000 5,272,000 1,338,000 3,700,000 14,737,000 5,850,000 95,664,000 19,000 467,000 G H 2017 1,342,000 18,650,000 8,221,000 7,577,000 3,050,000 2,289,000 12,000 41,141,000 7,015,000 13,865,000 48,742,000 55,952,000 1,855,000 3,227,000 171,797,000 9,953,000 4,656,000 2,029,000 477,000 2,197,000 11,115,000 30,427,000 33,538,000 5,926,000 1,504,000 3,900,000 18,697,000 6,149,000 100,141,000 21,000 464,000 20 1 21 Liabilities 22 Short-term borrowings, including current portion of long-term debt 23 Trade accounts payable 24 Dividends payable 25 Income taxes payable 26 Accrued compensation & related items 27 Other current liabilities 28 Total current liabilities 29 Long-term debt 30 Pension benefit obligations 31 Postretirement benefit obligations 32 Noncurrent deferred tax liabilities 33 Other taxes payable 34 Other noncurrent liabilities 35 Total liabilities 36 37 Stockholders' Equity 38 Preferred stock 39 Common stock 40 Additional paid-in capital 41 Treasury stock 42 Retained earnings (accumulated deficit) 43 Accumulated other comprehensive income (loss) 44 Equity attributable to noncontrolling interests 45 Total equity (deficit) 46 67 2,703,000 4,309,000 2,162,000 1,049,000 3,057,000 12,640,000 25,920,000 37,133,000 4,766,000 645,000 4,063,000 11,560,000 6,669,000 90,756,000 470,000 88,674,000 110,988,000 96,770,000 (11,688,000) 235,000 63,473,000 16,195,000 4,220,000 2,104,000 980,000 2,722,000 11,083,000 37,304,000 35,955,000 5,638,000 1,124,000 5,578,000 12,126,000 5,317,000 104,042,000 17,000 468,000 87,428,000 110,801,000 97,670,000 (11,640,000) 305,000 63,447,000 8,831,000 4,674,000 2,047,000 1,265,000 2,398,000 12,643,000 31,858,000 32,909,000 5,272,000 1,338,000 3,700,000 14,737,000 5,850,000 95,664,000 19,000 467,000 86,253,000 101,610,000 89,554,000 (11,275,000) 350,000 63,758,000 9,953,000 4,656,000 2,029,000 477,000 2,197,000 11,115,000 30,427,000 33,538,000 5,926,000 1,504,000 3,900,000 18,697,000 6,149,000 100,141,000 21,000 464,000 84,278,000 89,425,000 85,291,000 (9,321,000) 348,000 71,656,000 1 Pfizer Inc (NYS: PFE) 2 Report Date 3 Revenues 4 Cost of sales 5 Gross Profit 6 Selling, informational & administrative expenses 7 Research & development expenses 8 Amortization of intangible assets 9 Restructuring charges & certain acquisition-related costs 10 Gain (loss) on completion of Consumer Healthcare JV transaction 11 Interest income 12 Interest expense 13 Royalty-related income 14 other expenses 15 Income (loss) from continuing operations before provision for taxes on income 16 Provision (benefit) for taxes on income 17 Income (loss) from continuing operations after provision for taxes on income 18 Income (loss) from discontinued operations - net of tax 19 Net income before allocation to noncontrolling interests 20 Less: net income attributable to noncontrolling interests 21 Net income attributable to Pfizer Inc. 22 23 24 25 26 27 28 29 30 31 32 33 34 35 36 37 38 39 40 41 42 43 44 45 46 47 48 49 50 Ready Balance Sheet income statement Additional Data + B 2020 41,908,000 8,692,000 33,216,000 11,615,000 9,405,000 3,436,000 600,000 6,000 73,000 1,449,000 770,000 63,000 7,497,000 476,000 7,021,000 2,631,000 9,652,000 (36,000) 9,616,000 C D 2019 51,750,000 10,219,000 41,531,000 14,350,000 8,650,000 4,610,000 747,000 8,086,000 226,000 1,574,000 648,000 2,878,000 17,682,000 1,384,000 16,298,000 4,000 16,302,000 (29,000) 16,273,000 E F 2018 53,647,000 11,248,000 42,399,000 14,455,000 8,006,000 4,893,000 1,044,000 333,000 1,316,000 495,000 1,628,000 11,885,000 706,000 11,179,000 9,000 11,188,000 (35,000) 11,153,000 1 2 3 Accounts receivable, gross 4 Less allowance for doubtful accounts 5 6 Land 7 Buildings 8 Machinery & equipment 9 Fumiture, fixtures & other property, plar 10 Construction in progress 11 Property, plant & equipment, at cost 12 Less: accumulated depreciation 13 14 Tax rate 15 16 Cash from operations 17 18 19 20 21 22 23 24 25 26 27 28 29 30 31 32 33 34 35 36 37 38 39 40 41 42 43 44 45 46 47 48 49 50 61 4 Balance Sheet USE THIS INFORMATION ONLY IF NEEDED 2020 2019 8,438,000 9,251,000 508,000 527,000 444,000 516,000 9,022,000 10,068,000 11,153,000 12,281,000 4,541,000 4,930,000 3,552,000 2,960,000 28,712,000 30,755,000 14,812,000 16,788,000 35% 35% 14,403,000 12,588,000 1 Additional Data income statement 2018 8,566,000 541,000 500,000 9,920,000 11,871,000 4,693,000 2,992,000 29,976,000 16,591,000 35% 15,827,000 + G - H 2017 8,805,000 584,000 540,000 10,254,000 11,902,000 4,661,000 2,680,000 30,037,000 16,172,000 35% 16,470,000 Bristol Myers Squibb Co. (NYS: BMY) Report Date -Cash & cash equivalents 5 Marketable debt securities 6 Receivables, net 7 Inventories, net 8 Prepaid expenses & other current assets 9 Total current assets 10 Property, plant & equipment, net 11 Goodwill 12 Other intangible assets 13 Deferred income taxes 14 Marketable debt securities 15 Other non-current assets 16 Total assets 17 18 Liabilities 19 Short-term debt obligations 20 Accounts payable 21 Other current liabilities 22 Total current liabilities 23 Deferred income taxes 24 Long-term debt 25 Other non-current liabilities 26 Total liabilities 27 28 Stockholders' Equity 29 Common stock 30 Capital in excess of par value of stock 31 Accumulated other comprehensive income (loss) 32 Retained eamings 33 Less cost of treasury stock 34 Non-controlling interest 35 Total equity 36 37 38 39 40 41 42 43 44 45 46 47 48 49 50 4 Ready B C D E USE 2017 INFORMATION ONLY FOR CALCULATION OF RATIOS. 2019 2020 14,546 12,346 1,285 3,047 8,501 7,685 2,074 4,293 3,786 1,983 30,192 29,354 5,886 6,252 20,547 22,488 53,243 63,969 510 1,161 433 767 7,019 6,604 118,481 129,944 2,340 3,346 2,713 2,445 14,027 12,513 19,080 18,304 5,407 6,454 48,336 43,387 7,776 10,101 80,599 78,246 292 292 44,325 43,709 (1,520) 34,474 25,357 100 51,698 Balance sheet Income statement (1,839) 21,281 26,237 60 37,882 Additional info + . F 2018 6,911 1,973 5,965 1,195 1,116 17,160 5,027 6,538 1,091 1,371 1,775 2,024 34,986 1,703 1,892 7,059 10,654 4,559 5,646 20,859 221 2,081 (2,762) 34,065 19,574 96 14,127 G H 2017 5,421 1,391 6,300 1,166 576 14,854 5,001 6,863 1,210 1,610 2,480 1,533 33,551 987 2,248 6,328 9,563 5,166 6,975 21,704 221 1,898 (2,289) 31,160 19,249 106 11,847 Bristol Myers Squibb Co. (NYS: BMY) Report Date Net product sales Alliance & other revenues Total revenues Cost of products sold Marketing, selling & administrative expenses B Research & development expenses 3 Amortization of acquired intangible assets 0 Interest expense 11 Royalties & licensing income 12 Equity investment gains 13 Other expense (gain) 14 Total expenses 15 Earnings (loss) before income taxes 16 Provision for (benefit from) income taxes 17 Earnings after income taxes 18 Net eamings (loss) attributable to noncontrolling interest 19 Net Income 20 21 22 23 24 25 26 27 28 29 30 31 32 33 34 35 36 37 38 39 40 41 42 43 44 45 46 47 48 49 50 4 Balance sheet Income statement B 2020 41,321 1,197 42,518 11,773 7,661 11,143 9,688 1,420 1,527 1,228 10,459 49,389 C (6,871) 2,124 (8,995) (20) (9,015) Additional info + D 2019 25,174 971 26,145 8,078 4,871 6,148 1,135 656 1,360 279 1,921 21,170 4,975 1,515 3,460 3,439 (21) E F 2018 21,581 980 22,561 6,547 4,551 6,345 183 1,353 (512) (192) 16,593 5,968 1,021 4,947 4,920 (27) Trade receivables Less charge-backs & cash discounts Less allowance for expected credit loss Land Buildings Machinery, equipment & fixtures O Construction in progress 1 Gross property, plant & equipment 2 Less accumulated depreciation 3 4 Tax rate 15 16 Net cash flows from operating activities 17 18 19 20 21 22 23 24 25 26 27 28 29 30 31 32 33 34 35 36 37 38 39 40 41 42 43 44 45 46 47 48 49 50 61 Ready USE THIS INFORMATION ONLY IF NEEDED 2020 2019 6,888 391 21 187 6,336 3,157 527 10,207 3,955 Balance sheet 7,882 645 18 189 5,732 3,063 487 9,471 3,585 35% 14,052 Income statement 35% 8,067 Additional info F 2018 4,914 245 33 104 5,231 2,962 548 8,845 3,818 35% 5,940 + G H 2017 4,599 209 43 100 4,848 3,059 980 8,987 3,986 35% 5,275 A B C D E USE 2017 INFORMATION ONLY FOR CALCULATION OF RATIOS. 2020 1,784,000 10,437,000 2019 1,305,000 8,525,000 7,930,000 8,724,000 8,047,000 8,284,000 3,264,000 3,344,000 3,438,000 2,600,000 167,000 21,000 35,067,000 32,803,000 16,856,000 17,133,000 3,406,000 3,014,000 13,900,000 13,967,000 35,370,000 28,471,000 49,577,000 58,653,000 2,383,000 +2,099,000 4,569,000 4,450,000 154,229,000 167,489,000 2,703,000 16,195,000 4,309,000 4,220,000 2,162,000 2,104,000 1,049,000 980,000 3,057,000 2,722,000 12,640,000 11,083,000 25,920,000 37,304,000 37,133,000 35,955,000 4,766,000 5,638,000 645,000 1,124,000 4,063,000 5,578,000 11,560,000 12,126,000 6,669,000 6,317,000 90,756,000 104,042,000 17,000 470,000 468,000 1 2 Pfizer Inc (NYS: PFE) 3 Report Date 4 Cash & cash equivalents 5 Short-term investments 6 Trade accounts receivable 7 Inventories 8 Current tax assets 9 Other current assets 10 Assets held for sale 11 Total current assets 12 Equity-method investments 13 Long-term investments 14 Property, plant & equipment 15 Identifiable intangible assets 16 Goodwill 17 Noncurrent deferred tax assets & other noncurrent tax assets 18 Other noncurrent assets 19 Total assets 20 21 Liabilities 22 Short-term borrowings, including current portion of long-term debt 23 Trade accounts payable 24 Dividends payable 25 Income taxes payable 26 Accrued compensation & related items 27 Other current liabilities 28 Total current liabilities 29 Long-term debt 30 Pension benefit obligations 31 Postretirement benefit obligations 32 Noncurrent deferred tax liabilities 33 Other taxes payable 34 Other noncurrent liabilities 35 Total liabilities 36 37 Stockholders' Equity 38 Preferred stock 39 Common stock F 2018 1,139,000 17,694,000 8,025,000 7,508,000 3,374,000 2,461,000 9,725,000 49,926,000 2,767,000 13,385,000 35,210,000 53,411,000 1,924,000 2,799,000 159,422,000 8,831,000 4,674,000 2,047,000 1,265,000 2,398,000 12,643,000 31,858,000 32,909,000 5,272,000 1,338,000 3,700,000 14,737,000 5,850,000 95,664,000 19,000 467,000 G H 2017 1,342,000 18,650,000 8,221,000 7,577,000 3,050,000 2,289,000 12,000 41,141,000 7,015,000 13,865,000 48,742,000 55,952,000 1,855,000 3,227,000 171,797,000 9,953,000 4,656,000 2,029,000 477,000 2,197,000 11,115,000 30,427,000 33,538,000 5,926,000 1,504,000 3,900,000 18,697,000 6,149,000 100,141,000 21,000 464,000 20 1 21 Liabilities 22 Short-term borrowings, including current portion of long-term debt 23 Trade accounts payable 24 Dividends payable 25 Income taxes payable 26 Accrued compensation & related items 27 Other current liabilities 28 Total current liabilities 29 Long-term debt 30 Pension benefit obligations 31 Postretirement benefit obligations 32 Noncurrent deferred tax liabilities 33 Other taxes payable 34 Other noncurrent liabilities 35 Total liabilities 36 37 Stockholders' Equity 38 Preferred stock 39 Common stock 40 Additional paid-in capital 41 Treasury stock 42 Retained earnings (accumulated deficit) 43 Accumulated other comprehensive income (loss) 44 Equity attributable to noncontrolling interests 45 Total equity (deficit) 46 67 2,703,000 4,309,000 2,162,000 1,049,000 3,057,000 12,640,000 25,920,000 37,133,000 4,766,000 645,000 4,063,000 11,560,000 6,669,000 90,756,000 470,000 88,674,000 110,988,000 96,770,000 (11,688,000) 235,000 63,473,000 16,195,000 4,220,000 2,104,000 980,000 2,722,000 11,083,000 37,304,000 35,955,000 5,638,000 1,124,000 5,578,000 12,126,000 5,317,000 104,042,000 17,000 468,000 87,428,000 110,801,000 97,670,000 (11,640,000) 305,000 63,447,000 8,831,000 4,674,000 2,047,000 1,265,000 2,398,000 12,643,000 31,858,000 32,909,000 5,272,000 1,338,000 3,700,000 14,737,000 5,850,000 95,664,000 19,000 467,000 86,253,000 101,610,000 89,554,000 (11,275,000) 350,000 63,758,000 9,953,000 4,656,000 2,029,000 477,000 2,197,000 11,115,000 30,427,000 33,538,000 5,926,000 1,504,000 3,900,000 18,697,000 6,149,000 100,141,000 21,000 464,000 84,278,000 89,425,000 85,291,000 (9,321,000) 348,000 71,656,000 1 Pfizer Inc (NYS: PFE) 2 Report Date 3 Revenues 4 Cost of sales 5 Gross Profit 6 Selling, informational & administrative expenses 7 Research & development expenses 8 Amortization of intangible assets 9 Restructuring charges & certain acquisition-related costs 10 Gain (loss) on completion of Consumer Healthcare JV transaction 11 Interest income 12 Interest expense 13 Royalty-related income 14 other expenses 15 Income (loss) from continuing operations before provision for taxes on income 16 Provision (benefit) for taxes on income 17 Income (loss) from continuing operations after provision for taxes on income 18 Income (loss) from discontinued operations - net of tax 19 Net income before allocation to noncontrolling interests 20 Less: net income attributable to noncontrolling interests 21 Net income attributable to Pfizer Inc. 22 23 24 25 26 27 28 29 30 31 32 33 34 35 36 37 38 39 40 41 42 43 44 45 46 47 48 49 50 Ready Balance Sheet income statement Additional Data + B 2020 41,908,000 8,692,000 33,216,000 11,615,000 9,405,000 3,436,000 600,000 6,000 73,000 1,449,000 770,000 63,000 7,497,000 476,000 7,021,000 2,631,000 9,652,000 (36,000) 9,616,000 C D 2019 51,750,000 10,219,000 41,531,000 14,350,000 8,650,000 4,610,000 747,000 8,086,000 226,000 1,574,000 648,000 2,878,000 17,682,000 1,384,000 16,298,000 4,000 16,302,000 (29,000) 16,273,000 E F 2018 53,647,000 11,248,000 42,399,000 14,455,000 8,006,000 4,893,000 1,044,000 333,000 1,316,000 495,000 1,628,000 11,885,000 706,000 11,179,000 9,000 11,188,000 (35,000) 11,153,000 1 2 3 Accounts receivable, gross 4 Less allowance for doubtful accounts 5 6 Land 7 Buildings 8 Machinery & equipment 9 Fumiture, fixtures & other property, plar 10 Construction in progress 11 Property, plant & equipment, at cost 12 Less: accumulated depreciation 13 14 Tax rate 15 16 Cash from operations 17 18 19 20 21 22 23 24 25 26 27 28 29 30 31 32 33 34 35 36 37 38 39 40 41 42 43 44 45 46 47 48 49 50 61 4 Balance Sheet USE THIS INFORMATION ONLY IF NEEDED 2020 2019 8,438,000 9,251,000 508,000 527,000 444,000 516,000 9,022,000 10,068,000 11,153,000 12,281,000 4,541,000 4,930,000 3,552,000 2,960,000 28,712,000 30,755,000 14,812,000 16,788,000 35% 35% 14,403,000 12,588,000 1 Additional Data income statement 2018 8,566,000 541,000 500,000 9,920,000 11,871,000 4,693,000 2,992,000 29,976,000 16,591,000 35% 15,827,000 + G - H 2017 8,805,000 584,000 540,000 10,254,000 11,902,000 4,661,000 2,680,000 30,037,000 16,172,000 35% 16,470,000 Bristol Myers Squibb Co. (NYS: BMY) Report Date -Cash & cash equivalents 5 Marketable debt securities 6 Receivables, net 7 Inventories, net 8 Prepaid expenses & other current assets 9 Total current assets 10 Property, plant & equipment, net 11 Goodwill 12 Other intangible assets 13 Deferred income taxes 14 Marketable debt securities 15 Other non-current assets 16 Total assets 17 18 Liabilities 19 Short-term debt obligations 20 Accounts payable 21 Other current liabilities 22 Total current liabilities 23 Deferred income taxes 24 Long-term debt 25 Other non-current liabilities 26 Total liabilities 27 28 Stockholders' Equity 29 Common stock 30 Capital in excess of par value of stock 31 Accumulated other comprehensive income (loss) 32 Retained eamings 33 Less cost of treasury stock 34 Non-controlling interest 35 Total equity 36 37 38 39 40 41 42 43 44 45 46 47 48 49 50 4 Ready B C D E USE 2017 INFORMATION ONLY FOR CALCULATION OF RATIOS. 2019 2020 14,546 12,346 1,285 3,047 8,501 7,685 2,074 4,293 3,786 1,983 30,192 29,354 5,886 6,252 20,547 22,488 53,243 63,969 510 1,161 433 767 7,019 6,604 118,481 129,944 2,340 3,346 2,713 2,445 14,027 12,513 19,080 18,304 5,407 6,454 48,336 43,387 7,776 10,101 80,599 78,246 292 292 44,325 43,709 (1,520) 34,474 25,357 100 51,698 Balance sheet Income statement (1,839) 21,281 26,237 60 37,882 Additional info + . F 2018 6,911 1,973 5,965 1,195 1,116 17,160 5,027 6,538 1,091 1,371 1,775 2,024 34,986 1,703 1,892 7,059 10,654 4,559 5,646 20,859 221 2,081 (2,762) 34,065 19,574 96 14,127 G H 2017 5,421 1,391 6,300 1,166 576 14,854 5,001 6,863 1,210 1,610 2,480 1,533 33,551 987 2,248 6,328 9,563 5,166 6,975 21,704 221 1,898 (2,289) 31,160 19,249 106 11,847 Bristol Myers Squibb Co. (NYS: BMY) Report Date Net product sales Alliance & other revenues Total revenues Cost of products sold Marketing, selling & administrative expenses B Research & development expenses 3 Amortization of acquired intangible assets 0 Interest expense 11 Royalties & licensing income 12 Equity investment gains 13 Other expense (gain) 14 Total expenses 15 Earnings (loss) before income taxes 16 Provision for (benefit from) income taxes 17 Earnings after income taxes 18 Net eamings (loss) attributable to noncontrolling interest 19 Net Income 20 21 22 23 24 25 26 27 28 29 30 31 32 33 34 35 36 37 38 39 40 41 42 43 44 45 46 47 48 49 50 4 Balance sheet Income statement B 2020 41,321 1,197 42,518 11,773 7,661 11,143 9,688 1,420 1,527 1,228 10,459 49,389 C (6,871) 2,124 (8,995) (20) (9,015) Additional info + D 2019 25,174 971 26,145 8,078 4,871 6,148 1,135 656 1,360 279 1,921 21,170 4,975 1,515 3,460 3,439 (21) E F 2018 21,581 980 22,561 6,547 4,551 6,345 183 1,353 (512) (192) 16,593 5,968 1,021 4,947 4,920 (27) Trade receivables Less charge-backs & cash discounts Less allowance for expected credit loss Land Buildings Machinery, equipment & fixtures O Construction in progress 1 Gross property, plant & equipment 2 Less accumulated depreciation 3 4 Tax rate 15 16 Net cash flows from operating activities 17 18 19 20 21 22 23 24 25 26 27 28 29 30 31 32 33 34 35 36 37 38 39 40 41 42 43 44 45 46 47 48 49 50 61 Ready USE THIS INFORMATION ONLY IF NEEDED 2020 2019 6,888 391 21 187 6,336 3,157 527 10,207 3,955 Balance sheet 7,882 645 18 189 5,732 3,063 487 9,471 3,585 35% 14,052 Income statement 35% 8,067 Additional info F 2018 4,914 245 33 104 5,231 2,962 548 8,845 3,818 35% 5,940 + G H 2017 4,599 209 43 100 4,848 3,059 980 8,987 3,986 35% 5,275