Question: you will be given a Organization Profile in which you will then answer your questions according to the information in the Organization Profile. The questions
you will be given a Organization Profile in which you will then answer your questions according to the information in the Organization Profile. The questions should be formatted such that when I send you a Organizational Profile of an organizations, you can answer each questions by completing your rubric and providing a short sentence describing the evidence you used in your rubric rating.
1= Strong evidence that shows this is a very good, 2= some evidence that shows this is OK, 3= very little or no evidence that this is being done.
1. Are your job descriptions clear and concise, with essential and nonessential duties outlined?
2. How do you record grievances of employees and what do you do to resolve it?
3. Are rejected applicants notified in a timely manner?
4. Do all drug and background checks comply with the law and company policy to ensure that the individual's rights are not being violated and to limit the company's liability?
5. Are performance evaluations completed regularly and as described in company policy, and are there strategies in place to ensure that those evaluations are objective and fair?
6. Is there a policy in place that prohibits any and all types of workplace discrimination as required by state and federal law?
7. Do you comply with Equal Employment Opportunity policy at the company
8. Do you mention that you are an equal opportunity employer in job postings
9. Are employees aware of emergency procedures at the company
10. Do you have vacation policy at the company
11. Are paid time off (vacation, holidays, etc.) structures developed?
12. Are non-exempt employees compensated at least one and one-half times their hourly wage for any hours worked beyond 40 (including bonuses)?
13. Is the compensation plan communicated to all employees?
14. Are benefit plans reviewed annually?
15. Are employees informed/oriented regarding their benefits?
16. Are Summary Plan Descriptions provided to plan participants?
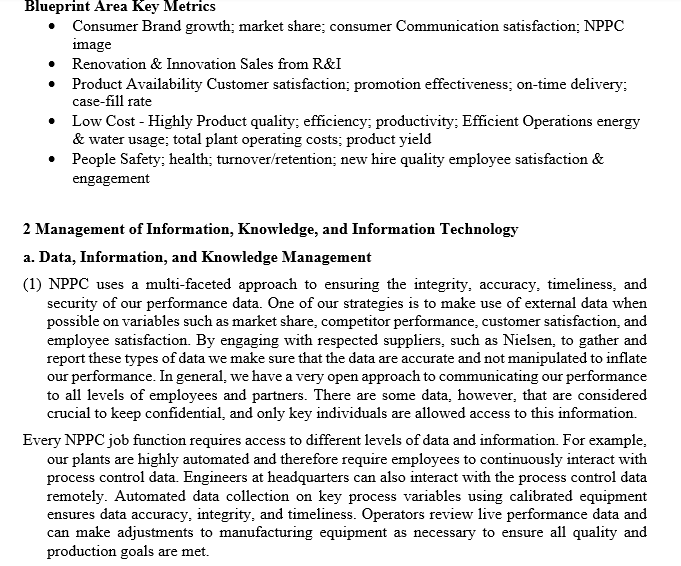
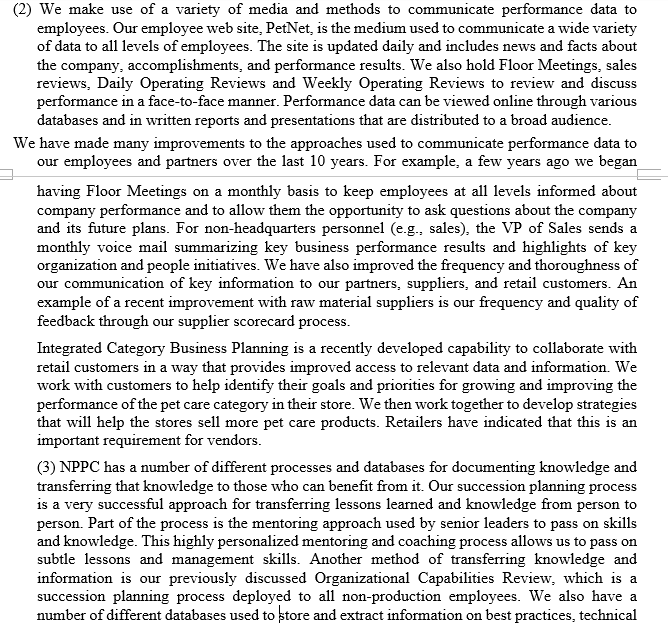
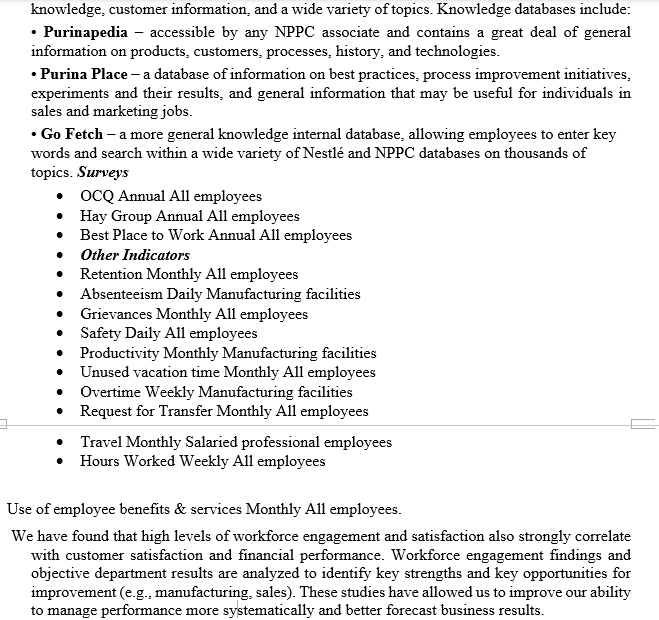
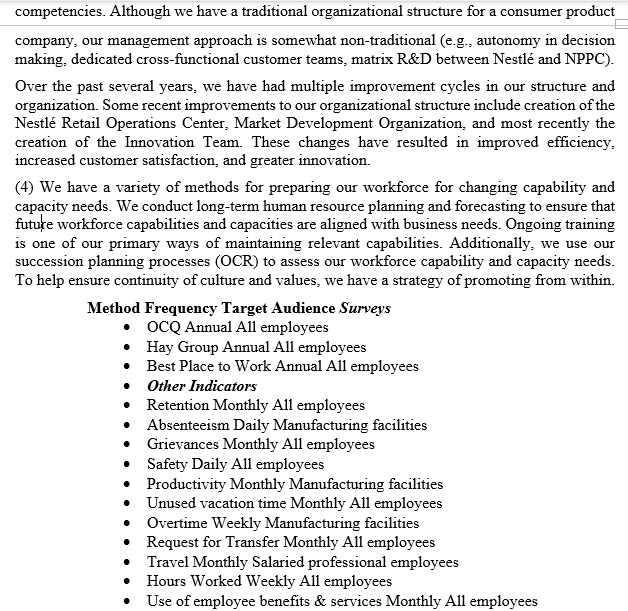
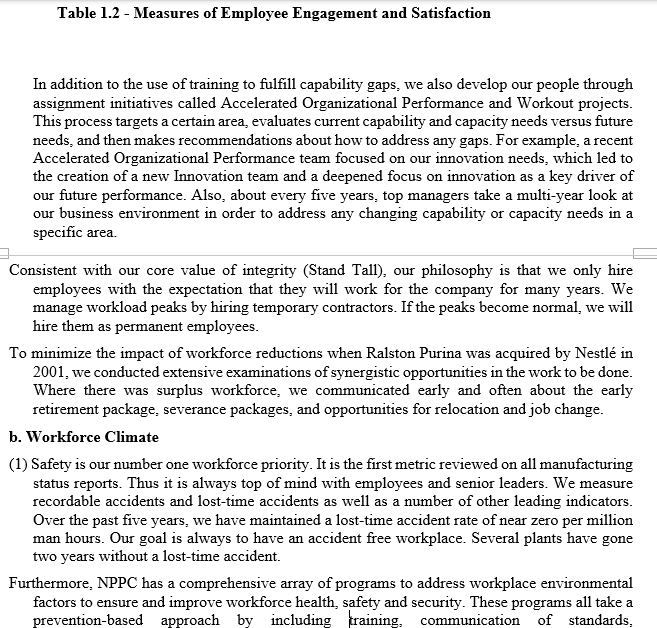
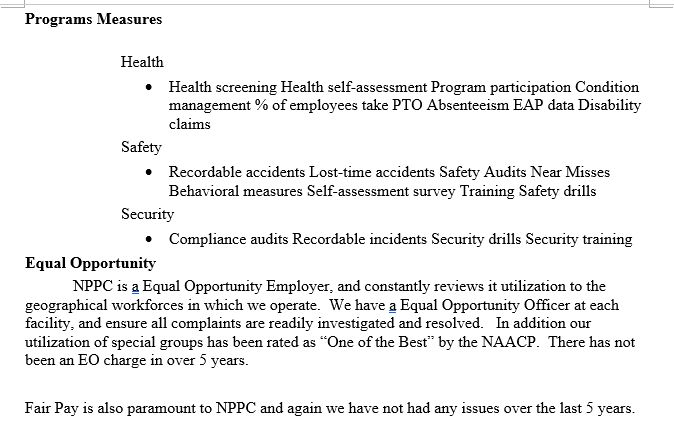
NESTLE ORGANIZATIONAL PROFILE P.1. Organizational Description With a 115 year history, Nestl Purina Pet Care Company (NPPC) is indeed a truly rare company. We have a long history of being a pioneer in pet food, as well as being the North American market leader with solid financial results. What is even more remarkable is that we have always been a company known as an exceptional place to work. Our record of caring for our employees, their families, our community, and of course pets, set us apart from many other well-known consumer product companies. We are a company that has been able to achieve success in all areas: financial market, customer satisfaction, ethics, community, environment, and people. Some of our more recent accomplishments include: consistently increasing customer satisfaction after the acquisition of Ralston Purina by Nestl in 2001, and thriving during one of the worst recessions America has seen in 50 years. Our deep knowledge of pets and the people who love them has enabled us to develop a series of innovative new products and grow sales in the pet food category for our customers. Five of the seven brands responsible for growth in the pet food category are Purina brands, which are among the fastest-growing brands. In 1894. William H. Danforth founded the Robinson-Danforth Commission Company in St. Louis, featuring a new animal feed product made of corn, oats and molasses. Previously, it was common practice to add cheap fillers such as sawdust to animal feeds. In 1898 Danforth entered the human foods business with "Purina" brand whole-wheat breakfast cereals. The name "Purina was coined to signify: Where purity is paramount," the company's first slogan. In 1902, Purina earned the endorsement of "Dr. Ralston," a health expert of the time, and the name of the Company was changed to Ralston Purina Company. Today, the red and white checkerboard is one of this country's most recognizable logos. Danforth selected the logo based on his memory of the Brown family from his youth, all of whom dressed in clothes from the same bolt of checkerboard cloth. According to legend. You couldn't miss a Brown kid." Danforth was not only a pioneer in animal food and business, but was known as one of the early motivational experts. His 1931 book I Dare You" remains in print today, and outlined a four-square development plan - Stand Tall, Think Tall, Smile Tall, and Live Tall. The "Four a Talls formed the foundation for the Purina values and culture. Today the Purina values are called the "Five Talls," and include a recently added fifth one: "We create tall with innovation." During the 1990's and into 2000. Ralston Purina sold or spun off all of its non-petcare businesses. In 2001, Purina became part of Nestl and is the number one U.S. pet care company in sales, volume and market share. P.1.a. Organizational Environment (1) Purina's main products are dog food, cat food, and cat litter. Some of our more popular brands are Beneful, Alpo, Pro Plan, Friskies. Fancy Feast, Purina ONEB, Cat Chow Dog ChowB, and Tidy Cats Litter. The company sells its products through retail stores such as mass merchandisers (e.g., Walmart), grocery stores, pet specialty stores (e.g., PetSmart) and drug store chains. Some specialty products such as prescription diets are also sold via veterinary offices. (2) NPPC's mission is: to enrich the lives of pets and the people who love them. Our vision is that we will see a day when there will be a checkerboard in every involved pet owner's home. What makes Purina unique? Our essence is that we are the most trusted pet care company. We continue to earn that trust every day because of our Core Competencies: Unparalleled knowledge of the wants and needs of customers (pets, consumers, retailers) Unmatched expertise in nutrition, developed from ethical research Comprehensive range of high quality established brands (product leadership) Highly efficient manufacturing and distribution network Innovation driving new product development Managing risk to achieve sustainable growth and profitability (3) NPPC employs approximately 7,000 employees. 2,000 in Headquarters/sales offices and the rest in plants located across the country. Safety is critical for plant employees and consequently we have a very comprehensive safety program. (4) NPPC's Headquarters is in St. Louis, Missouri, where the company was founded. Regional sales offices are located near major retail customer's headquarters such as Target in Eagan, Minnesota, and Walmart in Fayetteville, Arkansas. Manufacturing plants are spread around the country with facilities in Iowa, Colorado, Georgia, Missouri, Nebraska, New York, Oklahoma, Pennsylvania, Arizona, W. Virginia, California, Ohio and Wisconsin. We have three major types of manufacturing sites: wet food, dry food and cat litter. (5) NPPC is regulated by a number of government organizations and associations, including AAFCO (Association of American Feed Control Officials), EPA, FDA. IRS, MSHA (Mine Safety and Health Administration) for litter, OSHA, state agricultural departments, and USDA. NPPC has long prided itself on being a great place to work. Our turnover averages 3%, which is lower than typical manufacturing companies. NPPC was recognized as one of St. Louis' Best Places to Work in 2009 and 2010. A 2009 employee satisfaction survey by the Hay Group showed 97% satisfaction levels compared to a high performance benchmark of 75%. One of the key factors that motivate our employees is a passion for pets that is shared by virtually everyone who works at Purina. We feel a great deal of pride working for a company that is not only successful from a financial and marketplace standpoint, but one that really does enrich and improve the lives of pets and the people who love them. b. Organizational Relationships (1) NPPC is a Missouri Corporation and ultimately a wholly-owned subsidiary of Nestl S.A. (2) NPPC has three primary customers: Pets - the dogs and cats that consume or use our products, Consumers - the pet owners who purchase our products for their pets, and Customers - the retailers who stock and sell our products in their stores. Each of these three major types of customers (pets, consumers, and customers) is further broken down into smaller segments based on similar wants. needs, priorities, and characteristics. 0 NPPC is also involved with a number of other stakeholders, including Nestl, distributors, suppliers, the communities in which we have facilities, the environment influentials (breeders, dog/cat enthusiasts, shelters, veterinarians) and our employees. (3) NPPC's major suppliers are "front-end suppliers of raw materials, including meat, grain, vegetables, vitamins, and other food ingredients; packaging suppliers; and "back-end" suppliers such as railroads and trucking firms that transport our products. We also work with several advertising agencies and marketing firms that help us sell our products and promote NPPC brands. NPPC employs a systematic supplier selection process to help establish quality control. Each load of raw materials received from suppliers is inspected by NPPC. P.2 Organizational Situation a. Competitive Environment (1) NPPC is the market leader in pet food and cat litter throughout the U.S. and Canada. The checkerboard trademark is one of the most recognizable of all pet food brands. We compete with several multi-national companies, each having a number of pet food brands. The U.S. pet food industry is approximately $17 billion, and the U.S. has 72 million cats and 58 million dogs in 106 million households. Pet ownership trends have been relatively flat for the past several years, while dollar growth of the category has averaged about 4% per year. (2) NPPC products are differentiated from our competitors' products on a number of different dimensions. We have many differentiators for consumers and customers that make our company, our products, and our service competitive. We focus on developing high-quality products and marketing strategies that gain market share. Pro Plan dog food, for example, is used by the past five Best in Show winners at the Westminster Dog Show, and 93 of the top 100 show dogs in the country. (3) We gather a great deal of data from consumers, pets, market and consulting studies; our own industry experts, and other Nestl businesses. NPPC has studied and adopted processes from a number of companies in a wide variety of industries. Our customer report card system and OCQ process are based on processes of former Baldrige winning companies. We also obtain a wide variety of data from sources such as the American Customer Satisfaction Index developed by the University of Michigan, the Performance Monitor from the Advantage Group, and the Hay Group. b. Strategic Context NPPC faces a number of strategic challenges that cut across a variety of dimensions. Figure P.2.2 outlines the major challenges we face as well as our major strategy for addressing each one. Our key strategic advantages are presented in Figure P.2.1. c. Performance Improvement System The key elements of NPPC's performance improvement system are our values, consumer knowledge, selection of the right people, clear direction and alignment, entrepreneurial culture, autonomy with resources, and appropriate reward and recognition. This performance improvement system has created successful results, including sales and profit innovative new products Our strategic plan is called the Blueprint for Success and includes what we call our Pillars for Success." There are five pillars or areas of focus that stay the same from year to year. As part of our performance improvement efforts, we have done extensive benchmarking of Baldrige winning companies and taken their best processes and adapted them to NPPC. Examples include our leadership system, employee compensation, strategic planning, complaint management, recruiting selection, customer relationship management, and customer satisfaction measurement. We teach our employees a wide variety of performance improvement tools, allowing them to use what makes sense for the situation. In some cases, performance improvement systems are widely deployed, and in other cases, they are only implemented where applicable. For example, our manufacturing sites follow an approach that is based around the principles of Lean and Six Sigma. Other areas in the company follow different approaches tailored to their processes. An example of a widely deployed. systematic model for assessing and improving performance is our Organizational Capabilities Questionnaire (OCD). It was piloted in 1994, and we have refined and improved the process every year since then. This is not a typical employee climate survey. The OCQ is a comprehensive survey that assesses the key behaviors, processes and outcomes associated with successful execution of our Blueprint for Success (our strategic plan), meeting customer requirements, employee engagement, and leadership effectiveness. Because each department has a specific role to play in the execution of the Blueprint, we customize the survey for each specific function. In some functions, this survey exceeds 150 items. Each team of three or more receives a customized report and develops and executes an action plan based on their unique results. These efforts result in literally thousands of improvement actions executed each year, all of which are linked to our Blueprint. Another key element of this model is that results are only used for continuous improvement and development, not for performance evaluation or administrative purposes. The company-wide return rate over the past year was 95% with a high of 100% in multiple departments (such high return rates are evidence of the high levels of employee engagement). Some of the improvements to the OCQ include: Items that allow us to benchmark against other companies Items that allow us to evaluate and improve leadership performance Establishment of statistical linkage to specific business results and customer satisfaction where possible, thus validating the survey Workforce Focus 1. Workforce Engagement - How do you engage your workforce to achieve organizational and personal success? a. Workforce Enrichment (1) We use a variety of methods to determine the key factors affecting workforce engagement and satisfaction (e.g., surveys, focus groups, interviews, published research). Many of the key factors that affect our workforce engagement are the same things that affect anyone's workforce engagement, such as expressed satisfaction with the work itself, co-workers, supervision, pay and benefits, opportunity or advancement, and security. Additionally, we have found that there are certain functional and generational factors that impact workforce engagement. For example, with respect to Generation Y workers, we found that autonomy, culture, career development, work/life balance, focus on community, and focus on environment were key engagement factors. (2.3) NPPC has applied a multi-faceted approach in fostering an organizational culture characterized by open communication, high performance work, and an engaged workforce. The frequency with which we track the metrics varies depending on the metric, availability of data, and volatility of performance. We use these data to make key management decisions, allocate resources, diagnose problems, and make the most of opportunities. Blueprint Area Key Metrics Consumer Brand growth; market share; consumer Communication satisfaction; NPPC image Renovation & Innovation Sales from R&I Product Availability Customer satisfaction; promotion effectiveness; on-time delivery, case-fill rate Low Cost - Highly Product quality; efficiency; productivity: Efficient Operations energy & water usage; total plant operating costs; product yield Employees have been taught a number of different analysis models and techniques such as DMAIC (Six Sigma), SPC, comparative cause analysis, and root cause analysis. By tracking some metrics daily, we are able to quickly detect if our action plans are having the desired impact and make further adjustments when necessary. We also supplement the statistical data with softer data gathered via observation and questioning. For example, we get daily data from our largest customers because we are in contact with them daily. This way we can detect problems or issues early rather than waiting for a report to show a declining trend in some measure of customer satisfaction. c. Performance Improvement We make use of "Kaizen and other continuous improvement processes. Our Accelerating Organizational Performance (AOP) teams take a multi-year, strategic focus, while our Workout Sessions are focused on nearer-term needs. Furthermore, depending on the problem or opportunity, we have other methods for developing strategies for improvement. A product issue or an opportunity to create a new product that fills a void in our product portfolio is addressed by our Innovation Renovation processes. The responsibility for developing new products, processes, or other innovations is shared among Brand Marketing and the Innovation Renovation organization that works with other groups in NPPC and Nestl. These organizations evaluate and test ideas and new products/processes. The R&D Network also has its own goals, Blueprint, metrics and strategies for keeping the company at the forefront of pet care innovation. In some cases, the action needed to solve a problem is to change people or processes. Process changes and improvements are typically evaluated first by a team dedicated to this analysis, and then pilot tested to see if the changes produce positive results. Process changes or improvements are graded in a three-level system: 1. Understanding requires further research to evaluate effectiveness 2. Best practice - documented effectiveness and presented in best practice database 3. Tactical guidelines proven process changes or improvements that become mandatory or integrated into policies/procedures When appropriate, improvements and innovations are communicated to partners (e.g., distributors, suppliers) such as those that provide our raw materials or help deliver our products to the retail customer. These changes/improvements are deployed using a variety Blueprint Area Key Metrics Consumer Brand growth; market share; consumer Communication satisfaction: NPPC image Renovation & Innovation Sales from R&I Product Availability Customer satisfaction; promotion effectiveness; on-time delivery; case-fill rate Low Cost - Highly Product quality, efficiency, productivity: Efficient Operations energy & water usage; total plant operating costs; product yield People Safety; health; turnover/retention; new hire quality employee satisfaction & engagement 2 Management of Information, Knowledge, and Information Technology a. Data, Information, and Knowledge Management (1) NPPC uses a multi-faceted approach to ensuring the integrity, accuracy, timeliness, and security of our performance data. One of our strategies is to make use of external data when possible on variables such as market share, competitor performance, customer satisfaction, and employee satisfaction. By engaging with respected suppliers, such as Nielsen, to gather and report these types of data we make sure that the data are accurate and not manipulated to inflate our performance. In general, we have a very open approach to communicating our performance to all levels of employees and partners. There are some data, however, that are considered crucial to keep confidential, and only key individuals are allowed access to this information. Every NPPC job function requires access to different levels of data and information. For example, our plants are highly automated and therefore require employees to continuously interact with process control data. Engineers at headquarters can also interact with the process control data remotely. Automated data collection on key process variables using calibrated equipment ensures data accuracy, integrity, and timeliness. Operators review live performance data and can make adjustments to manufacturing equipment as necessary to ensure all quality and production goals are met. (2) We make use of a variety of media and methods to communicate performance data to employees. Our employee web site. PetNet, is the medium used to communicate a wide variety of data to all levels of employees. The site is updated daily and includes news and facts about the company, accomplishments, and performance results. We also hold Floor Meetings, sales reviews, Daily Operating Reviews and Weekly Operating Reviews to review and discuss performance in a face-to-face manner. Performance data can be viewed online through various databases and in written reports and presentations that are distributed to a broad audience. We have made many improvements to the approaches used to communicate performance data to our employees and partners over the last 10 years. For example, a few years ago we began having Floor Meetings on a monthly basis to keep employees at all levels informed about company performance and to allow them the opportunity to ask questions about the company and its future plans. For non-headquarters personnel (e.g., sales), the VP of Sales sends a monthly voice mail summarizing key business performance results and highlights of key organization and people initiatives. We have also improved the frequency and thoroughness of our communication of key information to our partners, suppliers, and retail customers. An example of a recent improvement with raw material suppliers is our frequency and quality of feedback through our supplier scorecard process. Integrated Category Business Planning is a recently developed capability to collaborate with retail customers in a way that provides improved access to relevant data and information. We work with customers to help identify their goals and priorities for growing and improving the performance of the pet care category in their store. We then work together to develop strategies that will help the stores sell more pet care products. Retailers have indicated that this is an important requirement for vendors. (3) NPPC has a number of different processes and databases for documenting knowledge and transferring that knowledge to those who can benefit from it. Our succession planning process is a very successful approach for transferring lessons learned and knowledge from person to person. Part of the process is the mentoring approach used by senior leaders to pass on skills and knowledge. This highly personalized mentoring and coaching process allows us to pass on subtle lessons and management skills. Another method of transferring knowledge and information is our previously discussed Organizational Capabilities Review, which is a succession planning process deployed to all non-production employees. We also have a number of different databases used to store and extract information on best practices, technical knowledge, customer information, and a wide variety of topics. Knowledge databases include: Purinapedia accessible by any NPPC associate and contains a great deal of general information on products, customers, processes, history, and technologies. Purina Place - a database of information on best practices, process improvement initiatives, experiments and their results, and general information that may be useful for individuals in sales and marketing jobs. . Go Fetch a more general knowledge internal database, allowing employees to enter key words and search within a wide variety of Nestl and NPPC databases on thousands of topics. Surveys OCQ Annual All employees Hay Group Annual All employees Best Place to Work Annual All employees Other Indicators Retention Monthly All employees Absenteeism Daily Manufacturing facilities Grievances Monthly All employees Safety Daily All employees Productivity Monthly Manufacturing facilities Unused vacation time Monthly All employees Overtime Weekly Manufacturing facilities Request for Transfer Monthly All employees Travel Monthly Salaried professional employees Hours Worked Weekly All employees . . . . Use of employee benefits & services Monthly All employees. We have found that high levels of workforce engagement and satisfaction also strongly correlate with customer satisfaction and financial performance. Workforce engagement findings and objective department results are analyzed to identify key strengths and key opportunities for improvement (e.g., manufacturing, sales). These studies have allowed us to improve our ability to manage performance more systematically and better forecast business results. 3 Workforce Environment: How do you build an effective and supportive workforce environment? a. Workforce Capability and Capacity (1) A key part of our planning process is to evaluate our workforce capability and capacity to develop appropriate staffing and development plans. The Organizational Capabilities Questionnaire is used to assess the workforce capabilities. The survey is designed to measure the key behaviors, processes, and outcomes for each department. We also conduct periodic broad assessments of capability and capacity needs. We have a multi-faceted approach to capacity planning to determine the needed workforce size and competencies and skills. Part of this plan is to determine if any head count or competency/skill gaps exist so that HR and department management can close the gaps if appropriate. The six-phase capacity planning process is fully integrated with our strategic planning process. (2) We have adopted a selection approach that helps maximize engagement as well as alignment with the company mission, vision, and values. We recruit widely, directing all recruits to our career site, www.NestlPurinaCareers.com, where they learn about the company, the culture, and the work environment. If they find it appealing, they can then pursue their interest further, thus increasing the probability for person-organization fit. This has resulted in not only a higher percentage of candidates who already embrace our values, but has also increased the diversity of applicants. We also have employees who are very willing to recommend NPPC as a great place to work, and so employees are sometimes our best recruiters. We have recently put our recruiting web site address on the back of business cards to make it easier for employees to recommend NPPC as a great place to work. As part of the hiring process, all new employees attend New Associate Orientation, which provides a broad overview of the company and its culture. Also, depending on their role, new employees may also get further department-specific or job-specific training. (3) We have a fairly traditional organizational structure. We have line and staff functions. We do not outsource many support functions or manufacturing and most of our manufacturing facilities are located in the United States. We outsource functions that are not core a competencies. Although we have a traditional organizational structure for a consumer product company, our management approach is somewhat non-traditional (e.g., autonomy in decision making, dedicated cross-functional customer teams, matrix R&D between Nestl and NPPC). Over the past several years, we have had multiple improvement cycles in our structure and organization. Some recent improvements to our organizational structure include creation of the Nestl Retail Operations Center, Market Development Organization, and most recently the creation of the Innovation Team. These changes have resulted in improved efficiency, increased customer satisfaction, and greater innovation. (4) We have a variety of methods for preparing our workforce for changing capability and capacity needs. We conduct long-term human resource planning and forecasting to ensure that futute workforce capabilities and capacities are aligned with business needs. Ongoing training is one of our primary ways of maintaining relevant capabilities. Additionally, we use our succession planning processes (OCR) to assess our workforce capability and capacity needs. To help ensure continuity of culture and values, we have a strategy of promoting from within. Method Frequency Target Audience Surveys OCQ Annual All employees Hay Group Annual All employees Best Place to Work Annual All employees Other Indicators Retention Monthly All employees Absenteeism Daily Manufacturing facilities Grievances Monthly All employees Safety Daily All employees Productivity Monthly Manufacturing facilities Unused vacation time Monthly All employees Overtime Weekly Manufacturing facilities Request for Transfer Monthly All employees Travel Monthly Salaried professional employees Hours Worked Weekly All employees Use of employee benefits & services Monthly All employees . Table 1.2 - Measures of Employee Engagement and Satisfaction In addition to the use of training to fulfill capability gaps, we also develop our people through assignment initiatives called Accelerated Organizational Performance and Workout projects. This process targets a certain area, evaluates current capability and capacity needs versus future needs, and then makes recommendations about how to address any gaps. For example, a recent Accelerated Organizational Performance team focused on our innovation needs, which led to the creation of a new Innovation team and a deepened focus on innovation as a key driver of our future performance. Also, about every five years, top managers take a multi-year look at our business environment in order to address any changing capability or capacity needs in a specific area. Consistent with our core value of integrity (Stand Tall), our philosophy is that we only hire employees with the expectation that they will work for the company for many years. We manage workload peaks by hiring temporary contractors. If the peaks become normal, we will hire them as permanent employees. To minimize the impact of workforce reductions when Ralston Purina was acquired by Nestl in 2001, we conducted extensive examinations of synergistic opportunities in the work to be done. Where there was surplus workforce, we communicated early and often about the early retirement package, severance packages, and opportunities for relocation and job change. b. Workforce Climate (1) Safety is our number one workforce priority. It is the first metric reviewed on all manufacturing status reports. Thus it is always top of mind with employees and senior leaders. We measure recordable accidents and lost-time accidents as well as a number of other leading indicators. Over the past five years, we have maintained a lost-time accident rate of near zero per million man hours. Our goal is always to have an accident free workplace. Several plants have gone two years without a lost-time accident. Furthermore, NPPC has a comprehensive array of programs to address workplace environmental factors to ensure and improve workforce health, safety and security. These programs all take a prevention-based approach by including training communication of standards, measurement/feedback, reward and recognition, drills, and audits. (2) An important benefit offered to our workforce is a work environment that encourages balance between family/personal life and work. We have a number of policies focused on achieving this work/life balance. For example, in our sales department, we have a policy of no out-of-town meetings on Monday morning or Friday afternoon in order to prevent travel on weekends. Furthermore, we have a wide variety of approaches for supporting our workforce including the following: adoption assistance, backup child care, bring pets to work, elder care. Employee Assistance Program, Healthworks, on-site library, mother's lactation lounge at headquarters, multiple options for health insurance, Nestl infant formula program, numerous product discount programs, on-site day care, on-site services such as cafeteria, company store, fitness center, dog park, fish pond, free parking, a park-like setting in downtown area. Solutions for Nursing Mothers program, tuition assistance, Universal Learning Curriculum, flextime, job- sharing and work from home options. We have made a number of changes to our benefits, services and policies over the years to adapt to feedback and changing needs of our workforce. There are some unique services and benefits offered to our manufacturing workforce. For example, some reward and recognition programs are designed around peer recognition, which we have found to be one of the most powerful forms of positive reinforcement. These include special celebrations/awards (e.g., hats, shirts, jackets) for safety milestones. Plant employees are also eligible for attendance awards and flextime where appropriate. Manufacturing employees also have a unique bonus program focused on safety, quality, productivity, and customer service results. Programs Measures Health Health screening Health self-assessment Program participation Condition management % of employees take PTO Absenteeism EAP data Disability claims Safety Recordable accidents Lost-time accidents Safety Audits Near Misses Behavioral measures Self-assessment survey Training Safety drills Security Compliance audits Recordable incidents Security drills Security training Equal Opportunity NPPC is a Equal Opportunity Employer, and constantly reviews it utilization to the geographical workforces in which we operate. We have a Equal Opportunity Officer at each facility, and ensure all complaints are readily investigated and resolved. In addition our utilization of special groups has been rated as "One of the Best by the NAACP. There has not been an EO charge in over 5 years. Fair Pay is also paramount to NPPC and again we have not had any issues over the last 5 years. NESTLE ORGANIZATIONAL PROFILE P.1. Organizational Description With a 115 year history, Nestl Purina Pet Care Company (NPPC) is indeed a truly rare company. We have a long history of being a pioneer in pet food, as well as being the North American market leader with solid financial results. What is even more remarkable is that we have always been a company known as an exceptional place to work. Our record of caring for our employees, their families, our community, and of course pets, set us apart from many other well-known consumer product companies. We are a company that has been able to achieve success in all areas: financial market, customer satisfaction, ethics, community, environment, and people. Some of our more recent accomplishments include: consistently increasing customer satisfaction after the acquisition of Ralston Purina by Nestl in 2001, and thriving during one of the worst recessions America has seen in 50 years. Our deep knowledge of pets and the people who love them has enabled us to develop a series of innovative new products and grow sales in the pet food category for our customers. Five of the seven brands responsible for growth in the pet food category are Purina brands, which are among the fastest-growing brands. In 1894. William H. Danforth founded the Robinson-Danforth Commission Company in St. Louis, featuring a new animal feed product made of corn, oats and molasses. Previously, it was common practice to add cheap fillers such as sawdust to animal feeds. In 1898 Danforth entered the human foods business with "Purina" brand whole-wheat breakfast cereals. The name "Purina was coined to signify: Where purity is paramount," the company's first slogan. In 1902, Purina earned the endorsement of "Dr. Ralston," a health expert of the time, and the name of the Company was changed to Ralston Purina Company. Today, the red and white checkerboard is one of this country's most recognizable logos. Danforth selected the logo based on his memory of the Brown family from his youth, all of whom dressed in clothes from the same bolt of checkerboard cloth. According to legend. You couldn't miss a Brown kid." Danforth was not only a pioneer in animal food and business, but was known as one of the early motivational experts. His 1931 book I Dare You" remains in print today, and outlined a four-square development plan - Stand Tall, Think Tall, Smile Tall, and Live Tall. The "Four a Talls formed the foundation for the Purina values and culture. Today the Purina values are called the "Five Talls," and include a recently added fifth one: "We create tall with innovation." During the 1990's and into 2000. Ralston Purina sold or spun off all of its non-petcare businesses. In 2001, Purina became part of Nestl and is the number one U.S. pet care company in sales, volume and market share. P.1.a. Organizational Environment (1) Purina's main products are dog food, cat food, and cat litter. Some of our more popular brands are Beneful, Alpo, Pro Plan, Friskies. Fancy Feast, Purina ONEB, Cat Chow Dog ChowB, and Tidy Cats Litter. The company sells its products through retail stores such as mass merchandisers (e.g., Walmart), grocery stores, pet specialty stores (e.g., PetSmart) and drug store chains. Some specialty products such as prescription diets are also sold via veterinary offices. (2) NPPC's mission is: to enrich the lives of pets and the people who love them. Our vision is that we will see a day when there will be a checkerboard in every involved pet owner's home. What makes Purina unique? Our essence is that we are the most trusted pet care company. We continue to earn that trust every day because of our Core Competencies: Unparalleled knowledge of the wants and needs of customers (pets, consumers, retailers) Unmatched expertise in nutrition, developed from ethical research Comprehensive range of high quality established brands (product leadership) Highly efficient manufacturing and distribution network Innovation driving new product development Managing risk to achieve sustainable growth and profitability (3) NPPC employs approximately 7,000 employees. 2,000 in Headquarters/sales offices and the rest in plants located across the country. Safety is critical for plant employees and consequently we have a very comprehensive safety program. (4) NPPC's Headquarters is in St. Louis, Missouri, where the company was founded. Regional sales offices are located near major retail customer's headquarters such as Target in Eagan, Minnesota, and Walmart in Fayetteville, Arkansas. Manufacturing plants are spread around the country with facilities in Iowa, Colorado, Georgia, Missouri, Nebraska, New York, Oklahoma, Pennsylvania, Arizona, W. Virginia, California, Ohio and Wisconsin. We have three major types of manufacturing sites: wet food, dry food and cat litter. (5) NPPC is regulated by a number of government organizations and associations, including AAFCO (Association of American Feed Control Officials), EPA, FDA. IRS, MSHA (Mine Safety and Health Administration) for litter, OSHA, state agricultural departments, and USDA. NPPC has long prided itself on being a great place to work. Our turnover averages 3%, which is lower than typical manufacturing companies. NPPC was recognized as one of St. Louis' Best Places to Work in 2009 and 2010. A 2009 employee satisfaction survey by the Hay Group showed 97% satisfaction levels compared to a high performance benchmark of 75%. One of the key factors that motivate our employees is a passion for pets that is shared by virtually everyone who works at Purina. We feel a great deal of pride working for a company that is not only successful from a financial and marketplace standpoint, but one that really does enrich and improve the lives of pets and the people who love them. b. Organizational Relationships (1) NPPC is a Missouri Corporation and ultimately a wholly-owned subsidiary of Nestl S.A. (2) NPPC has three primary customers: Pets - the dogs and cats that consume or use our products, Consumers - the pet owners who purchase our products for their pets, and Customers - the retailers who stock and sell our products in their stores. Each of these three major types of customers (pets, consumers, and customers) is further broken down into smaller segments based on similar wants. needs, priorities, and characteristics. 0 NPPC is also involved with a number of other stakeholders, including Nestl, distributors, suppliers, the communities in which we have facilities, the environment influentials (breeders, dog/cat enthusiasts, shelters, veterinarians) and our employees. (3) NPPC's major suppliers are "front-end suppliers of raw materials, including meat, grain, vegetables, vitamins, and other food ingredients; packaging suppliers; and "back-end" suppliers such as railroads and trucking firms that transport our products. We also work with several advertising agencies and marketing firms that help us sell our products and promote NPPC brands. NPPC employs a systematic supplier selection process to help establish quality control. Each load of raw materials received from suppliers is inspected by NPPC. P.2 Organizational Situation a. Competitive Environment (1) NPPC is the market leader in pet food and cat litter throughout the U.S. and Canada. The checkerboard trademark is one of the most recognizable of all pet food brands. We compete with several multi-national companies, each having a number of pet food brands. The U.S. pet food industry is approximately $17 billion, and the U.S. has 72 million cats and 58 million dogs in 106 million households. Pet ownership trends have been relatively flat for the past several years, while dollar growth of the category has averaged about 4% per year. (2) NPPC products are differentiated from our competitors' products on a number of different dimensions. We have many differentiators for consumers and customers that make our company, our products, and our service competitive. We focus on developing high-quality products and marketing strategies that gain market share. Pro Plan dog food, for example, is used by the past five Best in Show winners at the Westminster Dog Show, and 93 of the top 100 show dogs in the country. (3) We gather a great deal of data from consumers, pets, market and consulting studies; our own industry experts, and other Nestl businesses. NPPC has studied and adopted processes from a number of companies in a wide variety of industries. Our customer report card system and OCQ process are based on processes of former Baldrige winning companies. We also obtain a wide variety of data from sources such as the American Customer Satisfaction Index developed by the University of Michigan, the Performance Monitor from the Advantage Group, and the Hay Group. b. Strategic Context NPPC faces a number of strategic challenges that cut across a variety of dimensions. Figure P.2.2 outlines the major challenges we face as well as our major strategy for addressing each one. Our key strategic advantages are presented in Figure P.2.1. c. Performance Improvement System The key elements of NPPC's performance improvement system are our values, consumer knowledge, selection of the right people, clear direction and alignment, entrepreneurial culture, autonomy with resources, and appropriate reward and recognition. This performance improvement system has created successful results, including sales and profit innovative new products Our strategic plan is called the Blueprint for Success and includes what we call our Pillars for Success." There are five pillars or areas of focus that stay the same from year to year. As part of our performance improvement efforts, we have done extensive benchmarking of Baldrige winning companies and taken their best processes and adapted them to NPPC. Examples include our leadership system, employee compensation, strategic planning, complaint management, recruiting selection, customer relationship management, and customer satisfaction measurement. We teach our employees a wide variety of performance improvement tools, allowing them to use what makes sense for the situation. In some cases, performance improvement systems are widely deployed, and in other cases, they are only implemented where applicable. For example, our manufacturing sites follow an approach that is based around the principles of Lean and Six Sigma. Other areas in the company follow different approaches tailored to their processes. An example of a widely deployed. systematic model for assessing and improving performance is our Organizational Capabilities Questionnaire (OCD). It was piloted in 1994, and we have refined and improved the process every year since then. This is not a typical employee climate survey. The OCQ is a comprehensive survey that assesses the key behaviors, processes and outcomes associated with successful execution of our Blueprint for Success (our strategic plan), meeting customer requirements, employee engagement, and leadership effectiveness. Because each department has a specific role to play in the execution of the Blueprint, we customize the survey for each specific function. In some functions, this survey exceeds 150 items. Each team of three or more receives a customized report and develops and executes an action plan based on their unique results. These efforts result in literally thousands of improvement actions executed each year, all of which are linked to our Blueprint. Another key element of this model is that results are only used for continuous improvement and development, not for performance evaluation or administrative purposes. The company-wide return rate over the past year was 95% with a high of 100% in multiple departments (such high return rates are evidence of the high levels of employee engagement). Some of the improvements to the OCQ include: Items that allow us to benchmark against other companies Items that allow us to evaluate and improve leadership performance Establishment of statistical linkage to specific business results and customer satisfaction where possible, thus validating the survey Workforce Focus 1. Workforce Engagement - How do you engage your workforce to achieve organizational and personal success? a. Workforce Enrichment (1) We use a variety of methods to determine the key factors affecting workforce engagement and satisfaction (e.g., surveys, focus groups, interviews, published research). Many of the key factors that affect our workforce engagement are the same things that affect anyone's workforce engagement, such as expressed satisfaction with the work itself, co-workers, supervision, pay and benefits, opportunity or advancement, and security. Additionally, we have found that there are certain functional and generational factors that impact workforce engagement. For example, with respect to Generation Y workers, we found that autonomy, culture, career development, work/life balance, focus on community, and focus on environment were key engagement factors. (2.3) NPPC has applied a multi-faceted approach in fostering an organizational culture characterized by open communication, high performance work, and an engaged workforce. The frequency with which we track the metrics varies depending on the metric, availability of data, and volatility of performance. We use these data to make key management decisions, allocate resources, diagnose problems, and make the most of opportunities. Blueprint Area Key Metrics Consumer Brand growth; market share; consumer Communication satisfaction; NPPC image Renovation & Innovation Sales from R&I Product Availability Customer satisfaction; promotion effectiveness; on-time delivery, case-fill rate Low Cost - Highly Product quality; efficiency; productivity: Efficient Operations energy & water usage; total plant operating costs; product yield Employees have been taught a number of different analysis models and techniques such as DMAIC (Six Sigma), SPC, comparative cause analysis, and root cause analysis. By tracking some metrics daily, we are able to quickly detect if our action plans are having the desired impact and make further adjustments when necessary. We also supplement the statistical data with softer data gathered via observation and questioning. For example, we get daily data from our largest customers because we are in contact with them daily. This way we can detect problems or issues early rather than waiting for a report to show a declining trend in some measure of customer satisfaction. c. Performance Improvement We make use of "Kaizen and other continuous improvement processes. Our Accelerating Organizational Performance (AOP) teams take a multi-year, strategic focus, while our Workout Sessions are focused on nearer-term needs. Furthermore, depending on the problem or opportunity, we have other methods for developing strategies for improvement. A product issue or an opportunity to create a new product that fills a void in our product portfolio is addressed by our Innovation Renovation processes. The responsibility for developing new products, processes, or other innovations is shared among Brand Marketing and the Innovation Renovation organization that works with other groups in NPPC and Nestl. These organizations evaluate and test ideas and new products/processes. The R&D Network also has its own goals, Blueprint, metrics and strategies for keeping the company at the forefront of pet care innovation. In some cases, the action needed to solve a problem is to change people or processes. Process changes and improvements are typically evaluated first by a team dedicated to this analysis, and then pilot tested to see if the changes produce positive results. Process changes or improvements are graded in a three-level system: 1. Understanding requires further research to evaluate effectiveness 2. Best practice - documented effectiveness and presented in best practice database 3. Tactical guidelines proven process changes or improvements that become mandatory or integrated into policies/procedures When appropriate, improvements and innovations are communicated to partners (e.g., distributors, suppliers) such as those that provide our raw materials or help deliver our products to the retail customer. These changes/improvements are deployed using a variety Blueprint Area Key Metrics Consumer Brand growth; market share; consumer Communication satisfaction: NPPC image Renovation & Innovation Sales from R&I Product Availability Customer satisfaction; promotion effectiveness; on-time delivery; case-fill rate Low Cost - Highly Product quality, efficiency, productivity: Efficient Operations energy & water usage; total plant operating costs; product yield People Safety; health; turnover/retention; new hire quality employee satisfaction & engagement 2 Management of Information, Knowledge, and Information Technology a. Data, Information, and Knowledge Management (1) NPPC uses a multi-faceted approach to ensuring the integrity, accuracy, timeliness, and security of our performance data. One of our strategies is to make use of external data when possible on variables such as market share, competitor performance, customer satisfaction, and employee satisfaction. By engaging with respected suppliers, such as Nielsen, to gather and report these types of data we make sure that the data are accurate and not manipulated to inflate our performance. In general, we have a very open approach to communicating our performance to all levels of employees and partners. There are some data, however, that are considered crucial to keep confidential, and only key individuals are allowed access to this information. Every NPPC job function requires access to different levels of data and information. For example, our plants are highly automated and therefore require employees to continuously interact with process control data. Engineers at headquarters can also interact with the process control data remotely. Automated data collection on key process variables using calibrated equipment ensures data accuracy, integrity, and timeliness. Operators review live performance data and can make adjustments to manufacturing equipment as necessary to ensure all quality and production goals are met. (2) We make use of a variety of media and methods to communicate performance data to employees. Our employee web site. PetNet, is the medium used to communicate a wide variety of data to all levels of employees. The site is updated daily and includes news and facts about the company, accomplishments, and performance results. We also hold Floor Meetings, sales reviews, Daily Operating Reviews and Weekly Operating Reviews to review and discuss performance in a face-to-face manner. Performance data can be viewed online through various databases and in written reports and presentations that are distributed to a broad audience. We have made many improvements to the approaches used to communicate performance data to our employees and partners over the last 10 years. For example, a few years ago we began having Floor Meetings on a monthly basis to keep employees at all levels informed about company performance and to allow them the opportunity to ask questions about the company and its future plans. For non-headquarters personnel (e.g., sales), the VP of Sales sends a monthly voice mail summarizing key business performance results and highlights of key organization and people initiatives. We have also improved the frequency and thoroughness of our communication of key information to our partners, suppliers, and retail customers. An example of a recent improvement with raw material suppliers is our frequency and quality of feedback through our supplier scorecard process. Integrated Category Business Planning is a recently developed capability to collaborate with retail customers in a way that provides improved access to relevant data and information. We work with customers to help identify their goals and priorities for growing and improving the performance of the pet care category in their store. We then work together to develop strategies that will help the stores sell more pet care products. Retailers have indicated that this is an important requirement for vendors. (3) NPPC has a number of different processes and databases for documenting knowledge and transferring that knowledge to those who can benefit from it. Our succession planning process is a very successful approach for transferring lessons learned and knowledge from person to person. Part of the process is the mentoring approach used by senior leaders to pass on skills and knowledge. This highly personalized mentoring and coaching process allows us to pass on subtle lessons and management skills. Another method of transferring knowledge and information is our previously discussed Organizational Capabilities Review, which is a succession planning process deployed to all non-production employees. We also have a number of different databases used to store and extract information on best practices, technical knowledge, customer information, and a wide variety of topics. Knowledge databases include: Purinapedia accessible by any NPPC associate and contains a great deal of general information on products, customers, processes, history, and technologies. Purina Place - a database of information on best practices, process improvement initiatives, experiments and their results, and general information that may be useful for individuals in sales and marketing jobs. . Go Fetch a more general knowledge internal database, allowing employees to enter key words and search within a wide variety of Nestl and NPPC databases on thousands of topics. Surveys OCQ Annual All employees Hay Group Annual All employees Best Place to Work Annual All employees Other Indicators Retention Monthly All employees Absenteeism Daily Manufacturing facilities Grievances Monthly All employees Safety Daily All employees Productivity Monthly Manufacturing facilities Unused vacation time Monthly All employees Overtime Weekly Manufacturing facilities Request for Transfer Monthly All employees Travel Monthly Salaried professional employees Hours Worked Weekly All employees . . . . Use of employee benefits & services Monthly All employees. We have found that high levels of workforce engagement and satisfaction also strongly correlate with customer satisfaction and financial performance. Workforce engagement findings and objective department results are analyzed to identify key strengths and key opportunities for improvement (e.g., manufacturing, sales). These studies have allowed us to improve our ability to manage performance more systematically and better forecast business results. 3 Workforce Environment: How do you build an effective and supportive workforce environment? a. Workforce Capability and Capacity (1) A key part of our planning process is to evaluate our workforce capability and capacity to develop appropriate staffing and development plans. The Organizational Capabilities Questionnaire is used to assess the workforce capabilities. The survey is designed to measure the key behaviors, processes, and outcomes for each department. We also conduct periodic broad assessments of capability and capacity needs. We have a multi-faceted approach to capacity planning to determine the needed workforce size and competencies and skills. Part of this plan is to determine if any head count or competency/skill gaps exist so that HR and department management can close the gaps if appropriate. The six-phase capacity planning process is fully integrated with our strategic planning process. (2) We have adopted a selection approach that helps maximize engagement as well as alignment with the company mission, vision, and values. We recruit widely, directing all recruits to our career site, www.NestlPurinaCareers.com, where they learn about the company, the culture, and the work environment. If they find it appealing, they can then pursue their interest further, thus increasing the probability for person-organization fit. This has resulted in not only a higher percentage of candidates who already embrace our values, but has also increased the diversity of applicants. We also have employees who are very willing to recommend NPPC as a great place to work, and so employees are sometimes our best recruiters. We have recently put our recruiting web site address on the back of business cards to make it easier for employees to recommend NPPC as a great place to work. As part of the hiring process, all new employees attend New Associate Orientation, which provides a broad overview of the company and its culture. Also, depending on their role, new employees may also get further department-specific or job-specific training. (3) We have a fairly traditional organizational structure. We have line and staff functions. We do not outsource many support functions or manufacturing and most of our manufacturing facilities are located in the United States. We outsource functions that are not core a competencies. Although we have a traditional organizational structure for a consumer product company, our management approach is somewhat non-traditional (e.g., autonomy in decision making, dedicated cross-functional customer teams, matrix R&D between Nestl and NPPC). Over the past several years, we have had multiple improvement cycles in our structure and organization. Some recent improvements to our organizational structure include creation of the Nestl Retail Operations Center, Market Development Organization, and most recently the creation of the Innovation Team. These changes have resulted in improved efficiency, increased customer satisfaction, and greater innovation. (4) We have a variety of methods for preparing our workforce for changing capability and capacity needs. We conduct long-term human resource planning and forecasting to ensure that futute workforce capabilities and capacities are aligned with business needs. Ongoing training is one of our primary ways of maintaining relevant capabilities. Additionally, we use our succession planning processes (OCR) to assess our workforce capability and capacity needs. To help ensure continuity of culture and values, we have a strategy of promoting from within. Method Frequency Target Audience Surveys OCQ Annual All employees Hay Group Annual All employees Best Place to Work Annual All employees Other Indicators Retention Monthly All employees Absenteeism Daily Manufacturing facilities Grievances Monthly All employees Safety Daily All employees Productivity Monthly Manufacturing facilities Unused vacation time Monthly All employees Overtime Weekly Manufacturing facilities Request for Transfer Monthly All employees Travel Monthly Salaried professional employees Hours Worked Weekly All employees Use of employee benefits & services Monthly All employees . Table 1.2 - Measures of Employee Engagement and Satisfaction In addition to the use of training to fulfill capability gaps, we also develop our people through assignment initiatives called Accelerated Organizational Performance and Workout projects. This process targets a certain area, evaluates current capability and capacity needs versus future needs, and then makes recommendations about how to address any gaps. For example, a recent Accelerated Organizational Performance team focused on our innovation needs, which led to the creation of a new Innovation team and a deepened focus on innovation as a key driver of our future performance. Also, about every five years, top managers take a multi-year look at our business environment in order to address any changing capability or capacity needs in a specific area. Consistent with our core value of integrity (Stand Tall), our philosophy is that we only hire employees with the expectation that they will work for the company for many years. We manage workload peaks by hiring temporary contractors. If the peaks become normal, we will hire them as permanent employees. To minimize the impact of workforce reductions when Ralston Purina was acquired by Nestl in 2001, we conducted extensive examinations of synergistic opportunities in the work to be done. Where there was surplus workforce, we communicated early and often about the early retirement package, severance packages, and opportunities for relocation and job change. b. Workforce Climate (1) Safety is our number one workforce priority. It is the first metric reviewed on all manufacturing status reports. Thus it is always top of mind with employees and senior leaders. We measure recordable accidents and lost-time accidents as well as a number of other leading indicators. Over the past five years, we have maintained a lost-time accident rate of near zero per


