Answered step by step
Verified Expert Solution
Question
1 Approved Answer
>>> You will create an excel spreadsheet to predict the income and cost of Fred's Nursery: Fred's Nursery, a flower grower, plants a bed


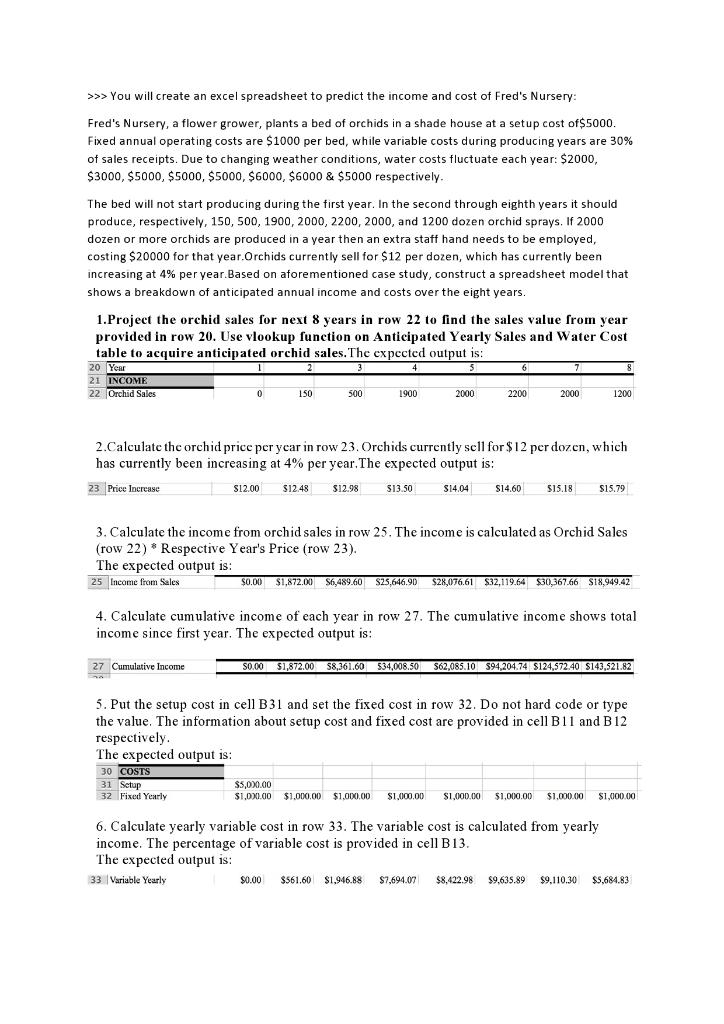
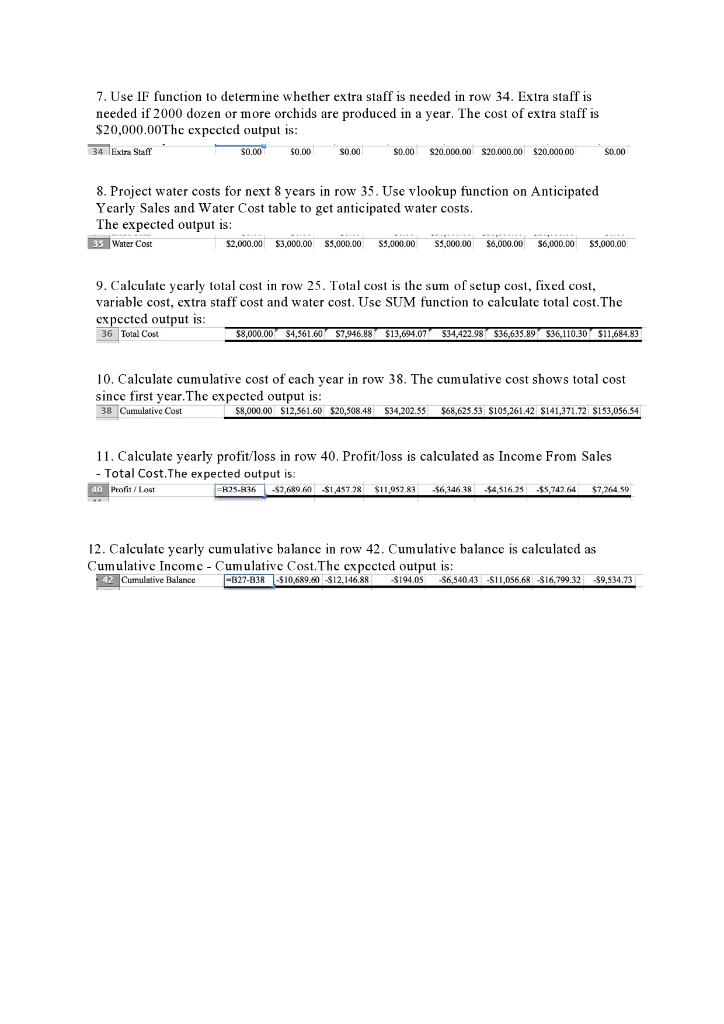
>>> You will create an excel spreadsheet to predict the income and cost of Fred's Nursery: Fred's Nursery, a flower grower, plants a bed of orchids in a shade house at a setup cost of $5000. Fixed annual operating costs are $1000 per bed, while variable costs during producing years are 30% of sales receipts. Due to changing weather conditions, water costs fluctuate each year: $2000, $3000, $5000, $5000, $5000, $6000, $6000 & $5000 respectively. The bed will not start producing during the first year. In the second through eighth years it should produce, respectively, 150, 500, 1900, 2000, 2200, 2000, and 1200 dozen orchid sprays. If 2000 dozen or more orchids are produced in a year then an extra staff hand needs to be employed, costing $20000 for that year.Orchids currently sell for $12 per dozen, which has currently been increasing at 4% per year. Based on aforementioned case study, construct a spreadsheet model that shows a breakdown of anticipated annual income and costs over the eight years. 1.Project the orchid sales for next 8 years in row 22 to find the sales value from year provided in row 20. Use vlookup function on Anticipated Yearly Sales and Water Cost table to acquire anticipated orchid sales. The expected output is: 3 4 20 Year 21 INCOME 22 Orchid Sales 0 150 27 Cumulative Income S 500 1900 The expected output is: 30 COSTS 31 Setup 32 Fixed Yearly 2000 $13.50 6 2200 2.Calculate the orchid price per year in row 23. Orchids currently sell for $12 per dozen, which has currently been increasing at 4% per year. The expected output is: 23 Price Increase $12.00 $12.48 $12.98 $14.04 $14.60 7 2000 $15.18 1200 3. Calculate the income from orchid sales in row 25. The income is calculated as Orchid Sales (row 22)* Respective Year's Price (row 23). The expected output is: 25 Income from Sales $15.79 4. Calculate cumulative income of each year in row 27. The cumulative income shows total income since first year. The expected output is: $0.00 $1,872.00 $6,489.60 $25,646.90 $28,076.61 $32,119.64 $30,367.66 $18,949.42 $0.00 $1,872.00 $8,361.60 $34,008.50 $62,085.10 $94,204.74 $124,572.40 $143,521.82 5. Put the setup cost in cell B31 and set the fixed cost in row 32. Do not hard code or type the value. The information about setup cost and fixed cost are provided in cell B11 and B12 respectively. $5,000.00 $1,000.00 $1,000.00 $1,000.00 $1,000.00 $1,000.00 $1,000.00 $1,000.00 $1,000.00 6. Calculate yearly variable cost in row 33. The variable cost is calculated from yearly income. The percentage of variable cost is provided in cell B13. The expected output is: 33 Variable Yearly $0.00 $561.60 $1,946.88 $7,694.07 $8,422.98 $9.635.89 $9,110.30 $5,684.83 7. Use IF function to determine whether extra staff is needed in row 34. Extra staff is needed if 2000 dozen or more orchids are produced in a year. The cost of extra staff is $20,000.00The expected output is: 34 Extra Staff $0.00 $0.00 $0.00 $0.00 $20.000.00 $20.000.00 $20.000.00 8. Project water costs for next 8 years in row 35. Use vlookup function on Anticipated Yearly Sales and Water Cost table to get anticipated water costs. The expected output is: 35 Water Cost $0.00 ***** $2,000.00 $3,000.00 $5,000.00 $5,000.00 $5,000.00 $6,000.00 $6,000.00 $5,000.00 9. Calculate yearly total cost in row 25. Total cost is the sum of setup cost, fixed cost, variable cost, extra staff cost and water cost. Use SUM function to calculate total cost. The expected output is: 36 Total Cost $8,000.00 $4,561.60 $7,946.88 $13,694.07 $34,422.98 $36,635.89 $36,110.30 $11,684.83 10. Calculate cumulative cost of each year in row 38. The cumulative cost shows total cost. since first year. The expected output is: 38 Cumulative Cost $8,000.00 $12,561.60 $20,508.48 $34,202.55 $68,625.53 $105,261.42 $141,371.72 $153,056.54 11. Calculate yearly profit/loss in row 40. Profit/loss is calculated as Income From Sales - Total Cost. The expected output is: 40 Profit/Lost =R25-836 $2,689.60 $1,457.28 $11,952.83 -$6,346.38 $4,516.25 $5,742.64 $7,264,59 12. Calculate yearly cumulative balance in row 42. Cumulative balance is calculated as Cumulative Income - Cumulative Cost. The expected output is: 42 Cumulative Balance -B27-1838 -$10,689.60 -$12,146.88 -$194.05 -$6,540.43 -$11,056.68 $16,799.32 $9,534.73
Step by Step Solution
There are 3 Steps involved in it
Step: 1
The question seems to involve assisting with the construction of an Excel spreadsheet based on a hypothetical scenario for Freds Nursery which involve...
Get Instant Access to Expert-Tailored Solutions
See step-by-step solutions with expert insights and AI powered tools for academic success
Step: 2

Step: 3

Ace Your Homework with AI
Get the answers you need in no time with our AI-driven, step-by-step assistance
Get Started


