

Answered step by step
Verified Expert Solution
Question
1 Approved Answer
You will design a regression Model where Distance from Coast is the Independent variable and Precipitation is the response. Run Minitab Stat>Regression>Fitted Line Plot Make
- You will design a regression Model where Distance from Coast is the Independent variable and Precipitation is the response. Run Minitab Stat>Regression>Fitted Line Plot
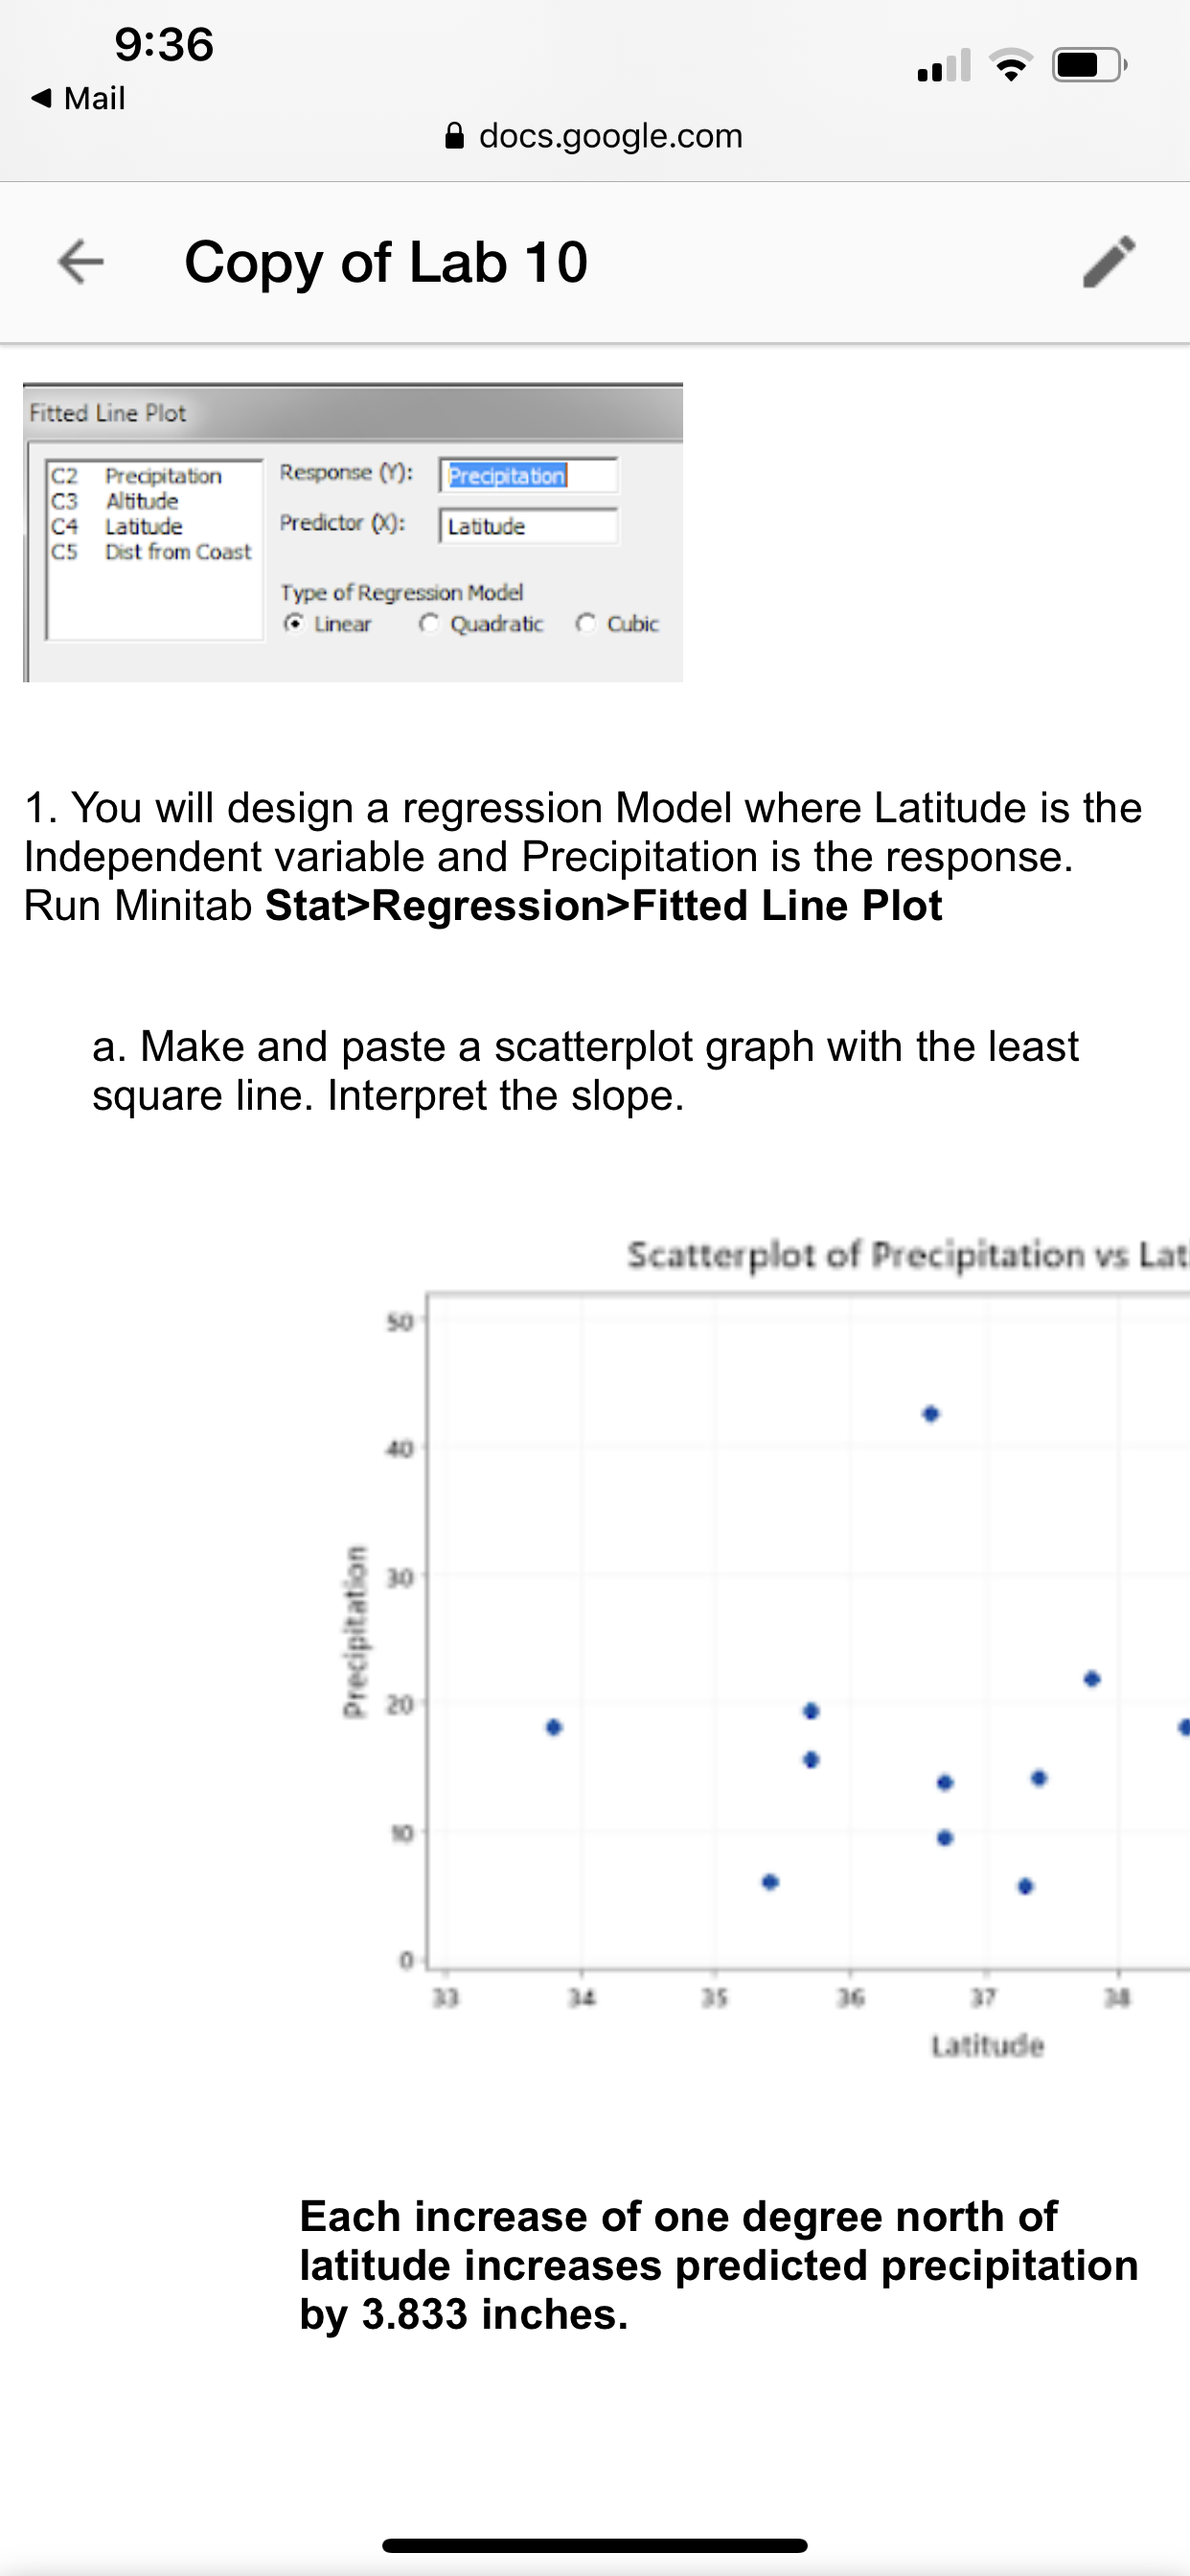
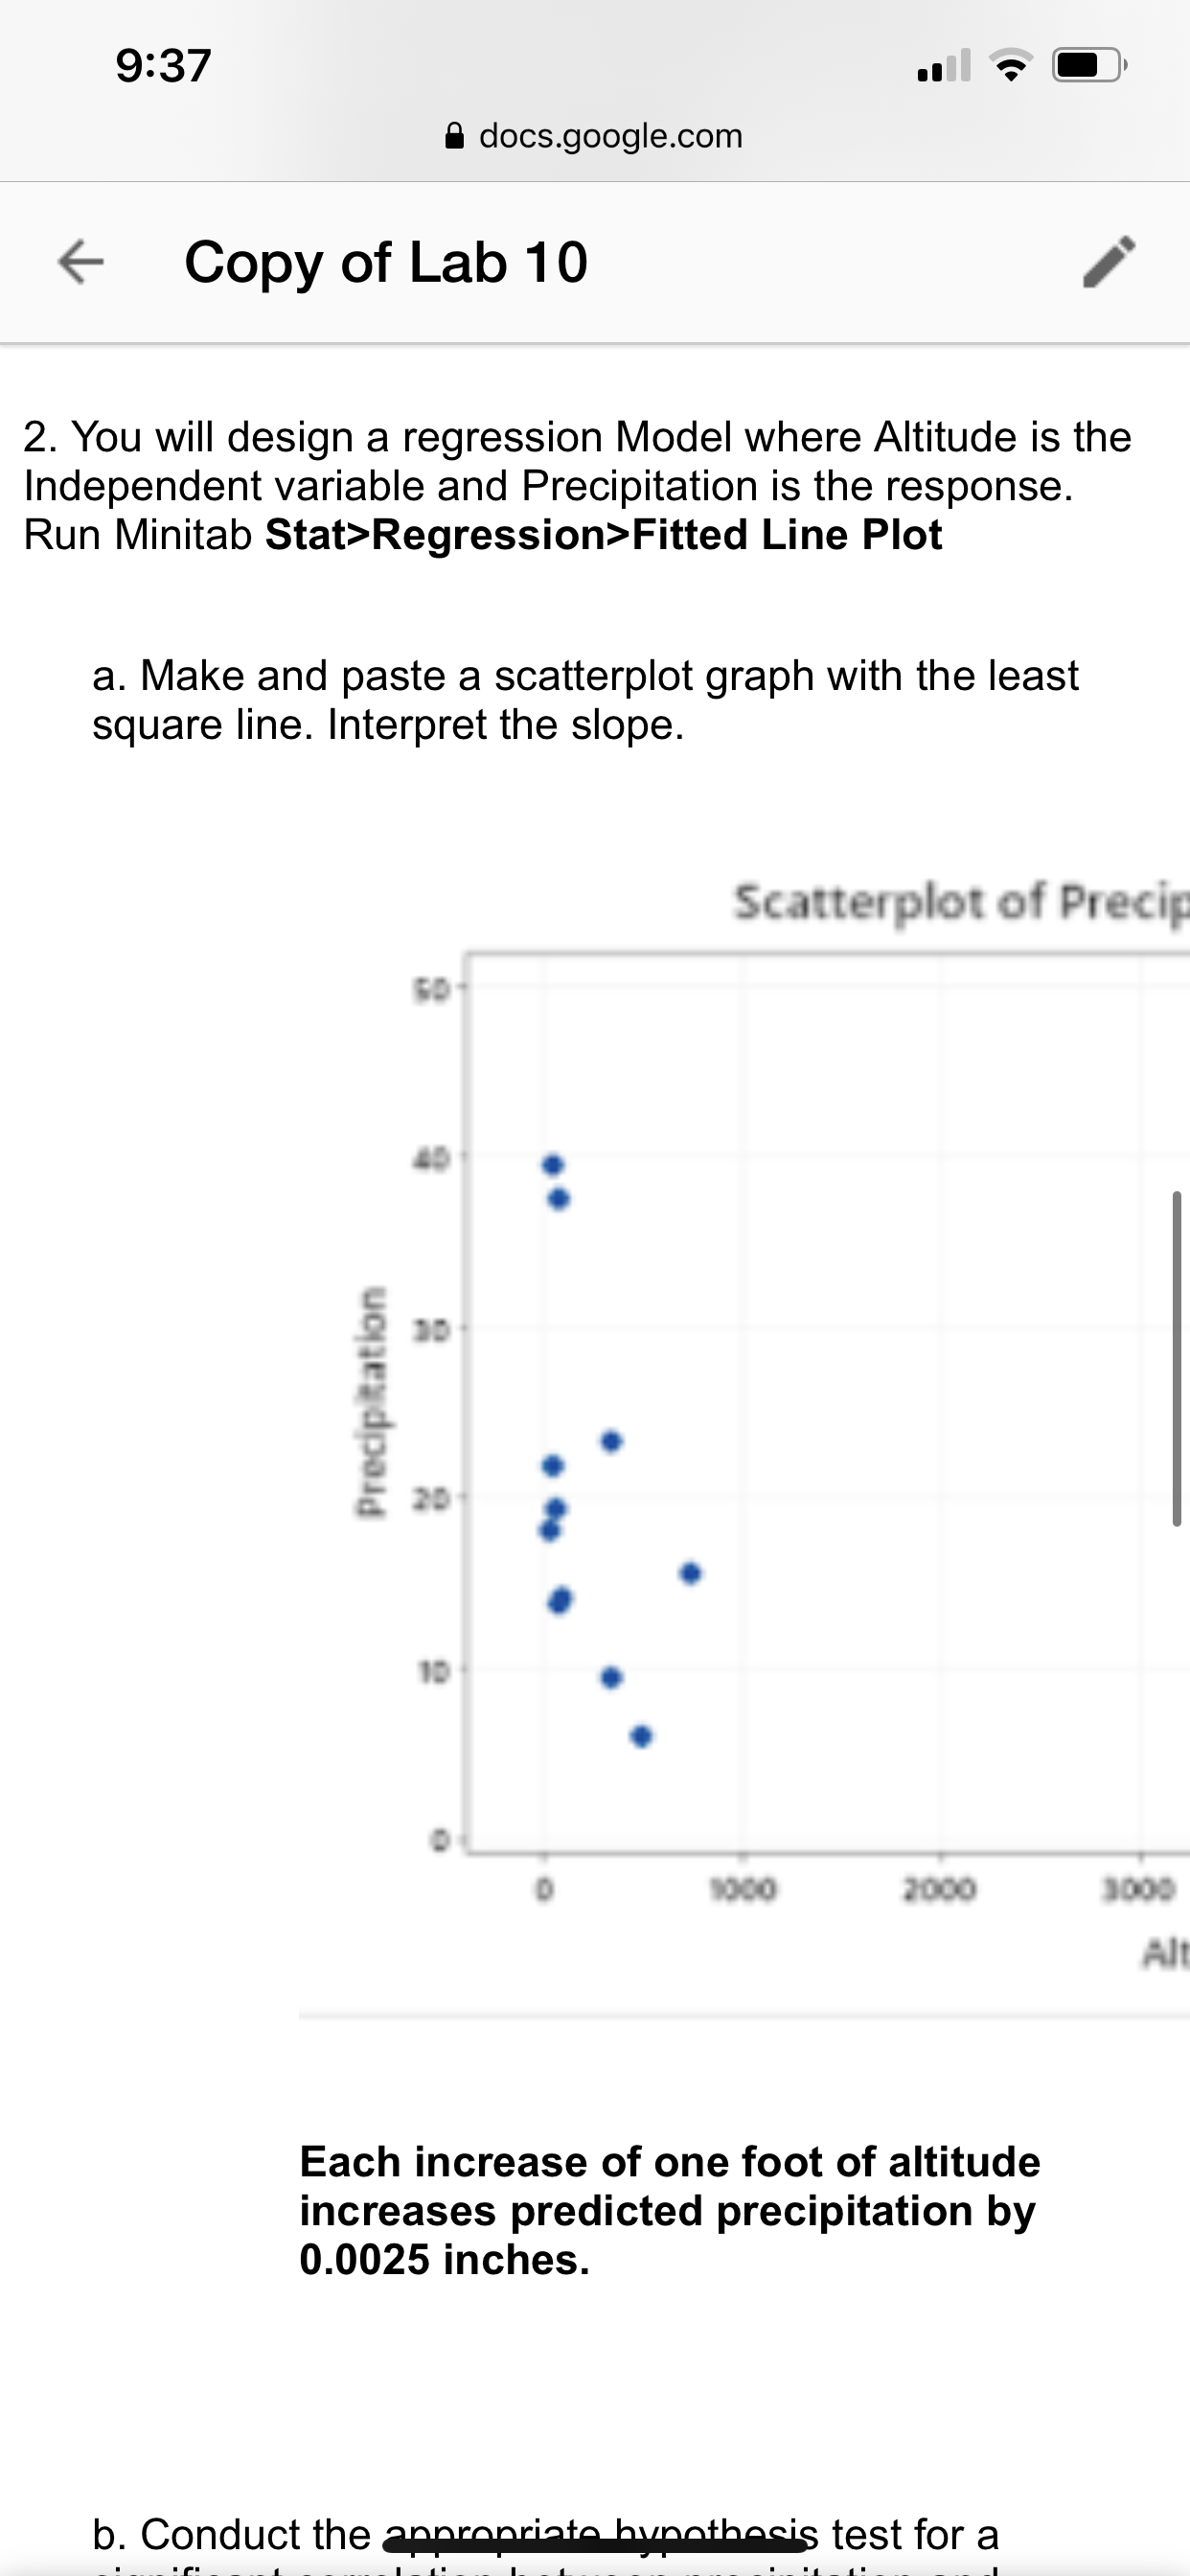
- Make and paste a scatterplot graph with the least square line. Interpret the slope.
- Conduct the appropriate hypothesis test for a significant correlation between precipitation and distance from coast. Show all steps.
- Find and interpret r2.
- Looking at the scatterplot, it seems that a non-linear regression model might be a better fit for precipitation and distance from coast. Rerun the fitted line plot but choose cubic instead on linear. Paste the graph here. Under this model, what percentage of the variability precipitation is explained by distance from coast?
Step by Step Solution
There are 3 Steps involved in it
Step: 1

Get Instant Access to Expert-Tailored Solutions
See step-by-step solutions with expert insights and AI powered tools for academic success
Step: 2

Step: 3
Ace Your Homework with AI
Get the answers you need in no time with our AI-driven, step-by-step assistance
Get Started
Calculus Early Transcendentals
Authors: James Stewart, Daniel K. Clegg, Saleem Watson, Lothar Redlin
9th Edition
1337613924, 978-1337613927