you will need this
if cant send excel add google link
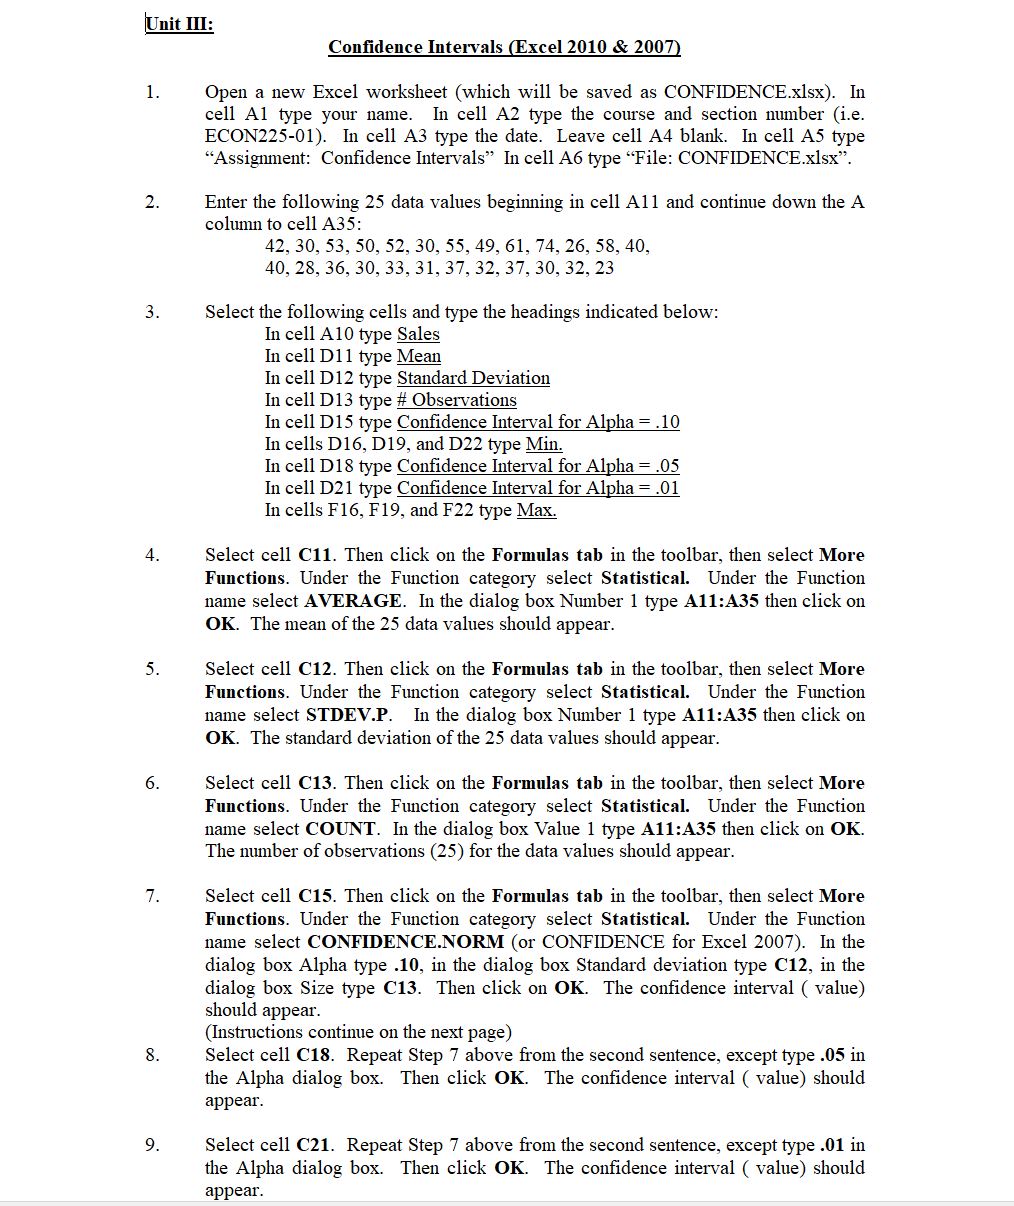
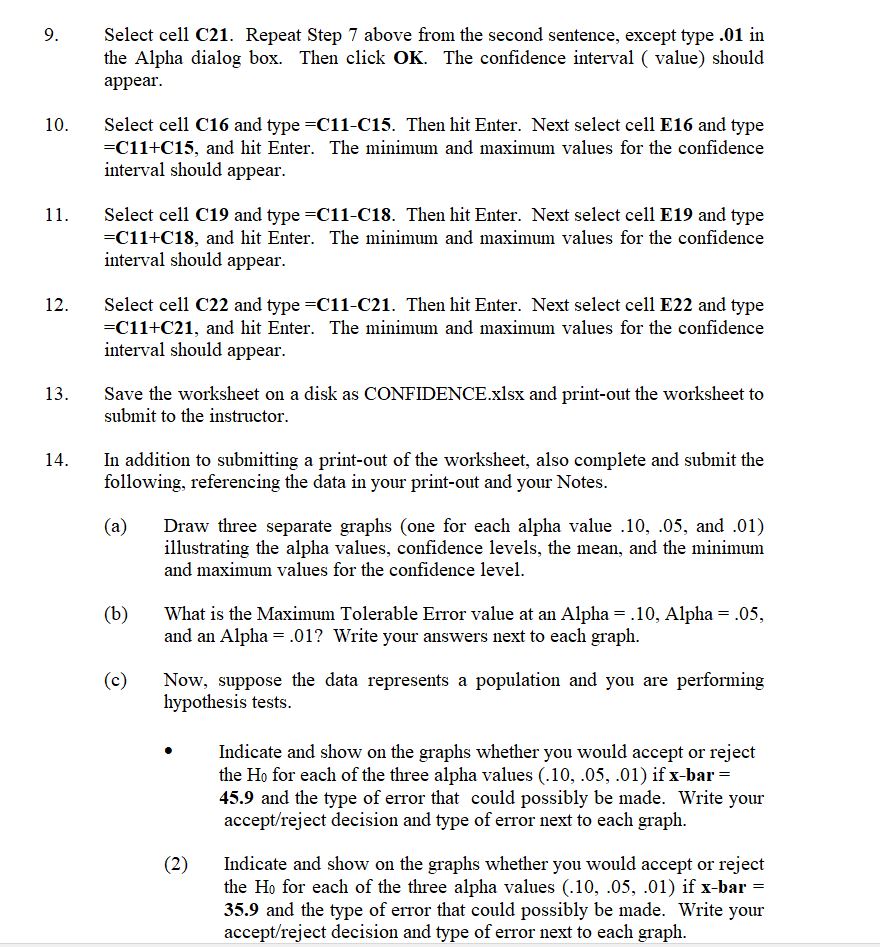
Condence Intervals xcel 2010 8: 200 Open a new Excel worksheet (which will be saved as CONFDJENCE.xlsx). In cell A1 type your name. In cell A2 type the course and section number (Le. ECON225-01). In cell A3 type the date. Leave cell A4 blank. In cell A5 type \"Assignment: Condence Intervals\" In cell A6 type \"File: CONFDJENCE.xlsx\". Enter the following 25 data values beginning in cell A11 and continue down the A column to cell A35: 42, 30, 53, 50, 52, 30, 55, 49, 61, 7'4, 26,58, 40, 40, 28, 36, 30, 33, 31, 37', 32, 37, 30, 32, 23 Select the following cells and type the headings indicated below: In cell A10 type Sales In cell D11 type Mean In cell D12 type Standard Deviation In cell D13 type # Observations In cell D15 type Condence Interval for Alpha = .10 In cells D16, D19, and D22 type @ In cell D18 type Condence Interval for Alpha = .05 In cell D21 type Condence Interval for Alpha = .01 In cells F16, F19, and F22 type Mi Select cell C11. Then click on the Formulas tab in the toolbar, then select More Functions. Under the Function category select Statistical. Under the Function name select AVERAGE. In the dialog box Number 1 type 2111:2135 then click on OK. The mean of the 25 data values should appear. Select cell C12. Then click on the Formulas tab in the toolbar, then select More Functions. Under the Function category select Statistical. Under the Function name select STDEV.P. In the dialog box Number 1 type A11:A35 then click on OK. The standard deviation of the 25 data values should appear. Select cell C13. Then click on the Formulas tab in the toolbar, then select More Funcons. Under the Function category select Statistical. Under the Function name select COUNT. In the dialog box Value 1 type A11:A35 then click on OK. The number of observations (25) for the data values should appear. Select cell C15. Then click on the Formulas tab in the toolbar, then select More Functions. Under the Function category select Statistical. Under the Function name select CONFEENCENORM (or CONFDJENCE for Excel 2007). In the dialog box Alpha type .10, in the dialog box Standard deviation type C12, in the dialog box Size type C13. Then click on OK. The condence interval ( value) should appear. (Instructions continue on the next page) Select cell C18. Repeat Step 7 above from the second sentence, except type .05 in the Alpha dialog box. Then click OK. The condence interval ( value) should appear. Select cell C21. Repeat Step 7 above from the second sentence, except type .01 in the Alpha dialog box. Then click OK. The condence interval ( value) should appear. 10. 11. 12. 13. 14. Select cell C21. Repeat Step 7 above from the second sentence, except type .01 in the Alpha dialog box. Then click OK. The condence interval ( value) should appear. Select cell C16 and type =C11ClS. Then hit Enter. Next select cell E16 and type =C11+C15, and hit Enter. The minimum and maximum values for the condence interval should appear. Select cell C19 and type =C11C18. Then hit Enter. Next select cell E19 and type =C11+C13, and hit Enter. The minimum and maximum values for the condence interval should appear. Select cell C22 and type =C11C21. Then hit Enter. Next select cell E22 and type =Cll+CZl, and hit Enter. The minimum and maximum values for the condence interval should appear. Save the worksheet on a disk as CONFDJENCExlsx and print-out the worksheet to submit to the instructor. In addition to submitting a print-out of the worksheet, also complete and submit the following, referencing the data in your print-out and your Notes. (a) Draw three separate graphs (one for each alpha value .10, .05, and .01} illustrating the alpha values, condence levels, the mean, and the minimum and maximum values for the condence level. (b) What is the Maximum Tolerable Error value at an Alpha = .10, Alpha = .05, and an Alpha = .01? Write your answers next to each graph. (c) Now, suppose the data represents a population and you are performing hypothesis tests. II Indicate and show on the graphs whether you would accept or reject the Ho for each of the three alpha values (.10, .05, .01) if xhar = 45.9 and the type of error that could possibly be made. Write your acceptl'rej ect decision and type of error next to each graph. (2} Indicate and show on the graphs whether you would accept or reject the Ho for each of the three alpha values (.10, .05, .01] if xhar = 35.9 and the type of error that could possibly be made. Write your acceptfrej ect decision and type of error next to each graph


