Answered step by step
Verified Expert Solution
Link Copied!

Question

1 Approved Answer

You work as a middle manager for one of the top U.S. producers of luxury and mass-market automobiles and trucks. The company from the course

You work as a middle manager for one of the top U.S. producers of luxury and mass-market automobiles and trucks. The company from the course scenario has decided to incorporate internet of things (IoT) technology in its vehicles (also called connected cars). Often organizations have to choose from multiple innovative implementation options. The choice is usually determined by many factors including the financial viability of each idea. In this assignment, you will compare the financial benefits for two innovation options and create data visualizations to help determine the option with greater financial benefit. This assignment will help you make a recommendation for one of the two options in Milestone One.image text in transcribed
  1. Create a chart for sales forecast data.
    1. Graph sales forecast data for total sales for options A and B on a three-dimensional stacked column chart.
    • Each column should show traditional sales on the bottom and connected sales on the top.
    • Both options may appear on the same three-dimensional chart, or you can make a separate chart for each option.
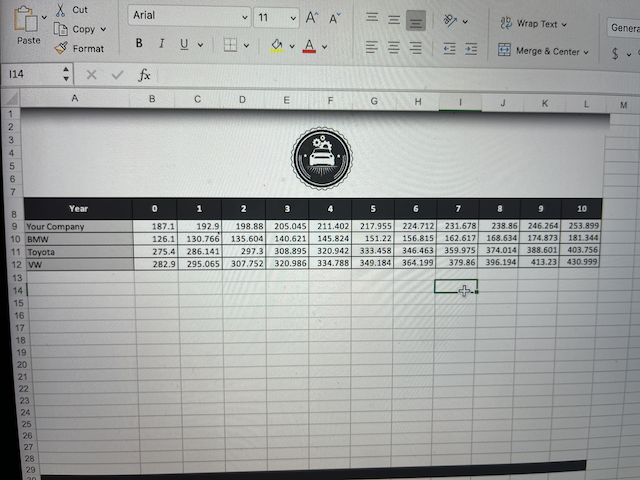
Arial X Cut [b Copy v v 11 y A 29 Wrap Text Tolle 10 D Genera Paste B Format v I U Av Merge & Center $ 114 X & fx A B D E F G H J L M 1 2 3 4 5 6 7 VE 0 1 2 3 5 6 7 8 9 10 187.1 126.1 275.4 282.9 LU 192.9 130.766 286.141 295.065 198.88 135.604 297.3 307.752 205.045 211.402 140.621 145.824 308.895 320.942 320.986 334.788 217.955 224.712 231.678 151.22 156.815 162.617 333.458 346.463 359.975 349.184 364.199 379.86 238.86 246.254 253.899 168.634 174.873 181.344 374.014 388.601 403.756 396.194 413.23 430.999 ---- Year 8 9 Your Company 10 BMW 11 Toyota 12 Vw 13 14 15 16 17 18 19 20 21 22 23 24 25 26 27 28 29 20 Arial X Cut [b Copy v v 11 y A 29 Wrap Text Tolle 10 D Genera Paste B Format v I U Av Merge & Center $ 114 X & fx A B D E F G H J L M 1 2 3 4 5 6 7 VE 0 1 2 3 5 6 7 8 9 10 187.1 126.1 275.4 282.9 LU 192.9 130.766 286.141 295.065 198.88 135.604 297.3 307.752 205.045 211.402 140.621 145.824 308.895 320.942 320.986 334.788 217.955 224.712 231.678 151.22 156.815 162.617 333.458 346.463 359.975 349.184 364.199 379.86 238.86 246.254 253.899 168.634 174.873 181.344 374.014 388.601 403.756 396.194 413.23 430.999 ---- Year 8 9 Your Company 10 BMW 11 Toyota 12 Vw 13 14 15 16 17 18 19 20 21 22 23 24 25 26 27 28 29 20

Step by Step Solution

There are 3 Steps involved in it

Step: 1

blur-text-image

Get Instant Access to Expert-Tailored Solutions

See step-by-step solutions with expert insights and AI powered tools for academic success

Step: 2

blur-text-image

Step: 3

blur-text-image

Ace Your Homework with AI

Get the answers you need in no time with our AI-driven, step-by-step assistance

Get Started

Recommended Textbook for

Derivatives Markets

Authors: Robert McDonald

3rd Edition

978-9332536746, 9789332536746

More Books

Students also viewed these Finance questions