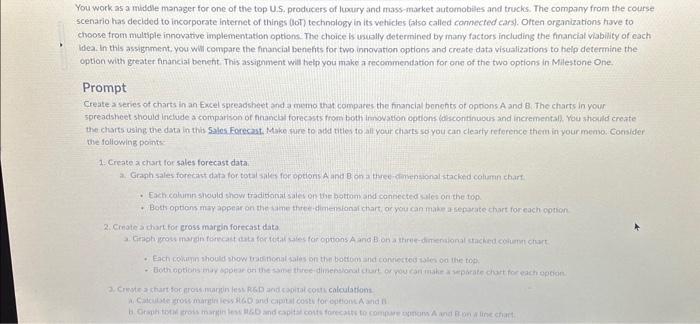
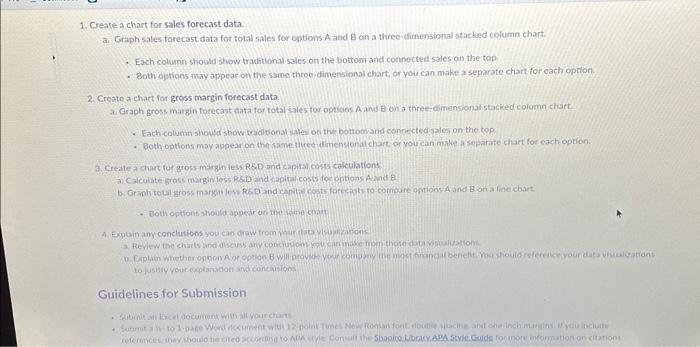
You work as a middle manager for one of the top U.S. producers of luoury and mass-market automobiles and trucks. The company from the course scenario has decided to incorporate internet of things (lot) technology in its wehicies falso called convected cars). Otten orkanizations have to choose from multiple innovative implementation options. The choice is usinlly determined by many factors including the financial viability of each lidea. In this assigrment. you whil conpare the firiancial benehts for two innovarton options and create data visualizations to help deternine the option with greater financiaf beneht. This assignment will help you make a recommendation for one of the two options in Milestone One. Prompt Create a series of charts in an Eucel spceadsheet and a memo that compares the financial bonehts of opnons A and Bi, The charts in your spreadsheet should include a cormparison of fnanclat forecssts froma both inmowation options fdsscontinuous and incremental). You should ere,ate the charts using the data in this Salos Forecast Make sure to add titles to all your charts so you can clearfy re ference them in your menho: Corisider the following points- 1. Create a chart for sales forecast data a. Graph sales forecist data for total sales for options A and B on a threc damentonal itached columnn chart: - Each calurtishould thay traditonalsales on the botrom and canpected sules onithe tood. - Bosts optoons mimy apgear on the alame three dimensionaf chart, or you can make a se parate chart for each option 2. Create a chart. fot cross margin forecast data. a. Cafcuate groks margict iess sida and cipura dosti to bpetonc A and it 1. Create a chart tor sales forecast data. a. Graph sales forecast data for total sales for options A and B on a three-dimensional stacked column chart. 2. Each column should stiow traditional sales on the bottom and connected sales on the top - Both options inay appear on the same three-dimensional chart or you can make a separate chart for each option. 2. Create a chart for gross margin forecast data. a. Graph gross margin forecast dati for total sales for ogtions A and B on a three-dimensionarstacked column chart - Each column should show waditonal wles on the bottom and connected sales on the top. - Both optioms may appear on the same uired dimensonal chart or you can make a separate chart for each option. 3. Create a chart fok gross margin iess RED and capitai cors cakculations a. Calculate gross margin less RSD and rapitai costs for options Aand B b. Graph total gross margin les Ro. Dand canitad costs forefinth to compure options A and B on a line chart. - tooth options should appear on mo kime chant 4. Expair any conclusions you can draw trom yourdis whuationans to jusuly youremianation sndronchisions Guidelines for Submission - sabinit an thicerfociment wim al yourchart You work as a middle manager for one of the top U.S. producers of luoury and mass-market automobiles and trucks. The company from the course scenario has decided to incorporate internet of things (lot) technology in its wehicies falso called convected cars). Otten orkanizations have to choose from multiple innovative implementation options. The choice is usinlly determined by many factors including the financial viability of each lidea. In this assigrment. you whil conpare the firiancial benehts for two innovarton options and create data visualizations to help deternine the option with greater financiaf beneht. This assignment will help you make a recommendation for one of the two options in Milestone One. Prompt Create a series of charts in an Eucel spceadsheet and a memo that compares the financial bonehts of opnons A and Bi, The charts in your spreadsheet should include a cormparison of fnanclat forecssts froma both inmowation options fdsscontinuous and incremental). You should ere,ate the charts using the data in this Salos Forecast Make sure to add titles to all your charts so you can clearfy re ference them in your menho: Corisider the following points- 1. Create a chart for sales forecast data a. Graph sales forecist data for total sales for options A and B on a threc damentonal itached columnn chart: - Each calurtishould thay traditonalsales on the botrom and canpected sules onithe tood. - Bosts optoons mimy apgear on the alame three dimensionaf chart, or you can make a se parate chart for each option 2. Create a chart. fot cross margin forecast data. a. Cafcuate groks margict iess sida and cipura dosti to bpetonc A and it 1. Create a chart tor sales forecast data. a. Graph sales forecast data for total sales for options A and B on a three-dimensional stacked column chart. 2. Each column should stiow traditional sales on the bottom and connected sales on the top - Both options inay appear on the same three-dimensional chart or you can make a separate chart for each option. 2. Create a chart for gross margin forecast data. a. Graph gross margin forecast dati for total sales for ogtions A and B on a three-dimensionarstacked column chart - Each column should show waditonal wles on the bottom and connected sales on the top. - Both optioms may appear on the same uired dimensonal chart or you can make a separate chart for each option. 3. Create a chart fok gross margin iess RED and capitai cors cakculations a. Calculate gross margin less RSD and rapitai costs for options Aand B b. Graph total gross margin les Ro. Dand canitad costs forefinth to compure options A and B on a line chart. - tooth options should appear on mo kime chant 4. Expair any conclusions you can draw trom yourdis whuationans to jusuly youremianation sndronchisions Guidelines for Submission - sabinit an thicerfociment wim al yourchart


