Answered step by step
Verified Expert Solution
Question
1 Approved Answer
You work for a large drone manufacturer and have been tasked to perform an Independent V&V effort on the quality of the manufacturing process as
You work for a large drone manufacturer and have been tasked to perform an Independent V&V effort on the quality of the manufacturing process as well as the end product, a drone ready for sale. The data you have been given was produced by the resident QA engineer. Here are some basic project characteristics:
The resident QA engineer decided to focus on the final quality test of the production line and, in particular, on the PassFail of the QC test.
The accepted Fail rate for the QA test is so of the manufactured drones should pass QC checks.
There are three independent manufacturing lines that run hours per day. The manufacturing lines operate in three shifts. They start at am and end at pm with fivehour shifts.
Each manufacturing line shift is composed of three people.
Each manufacturing line is composed of three stations, and the person working the stations is rotated for each work shift.
The QC stations also work the same threeshift schedule.
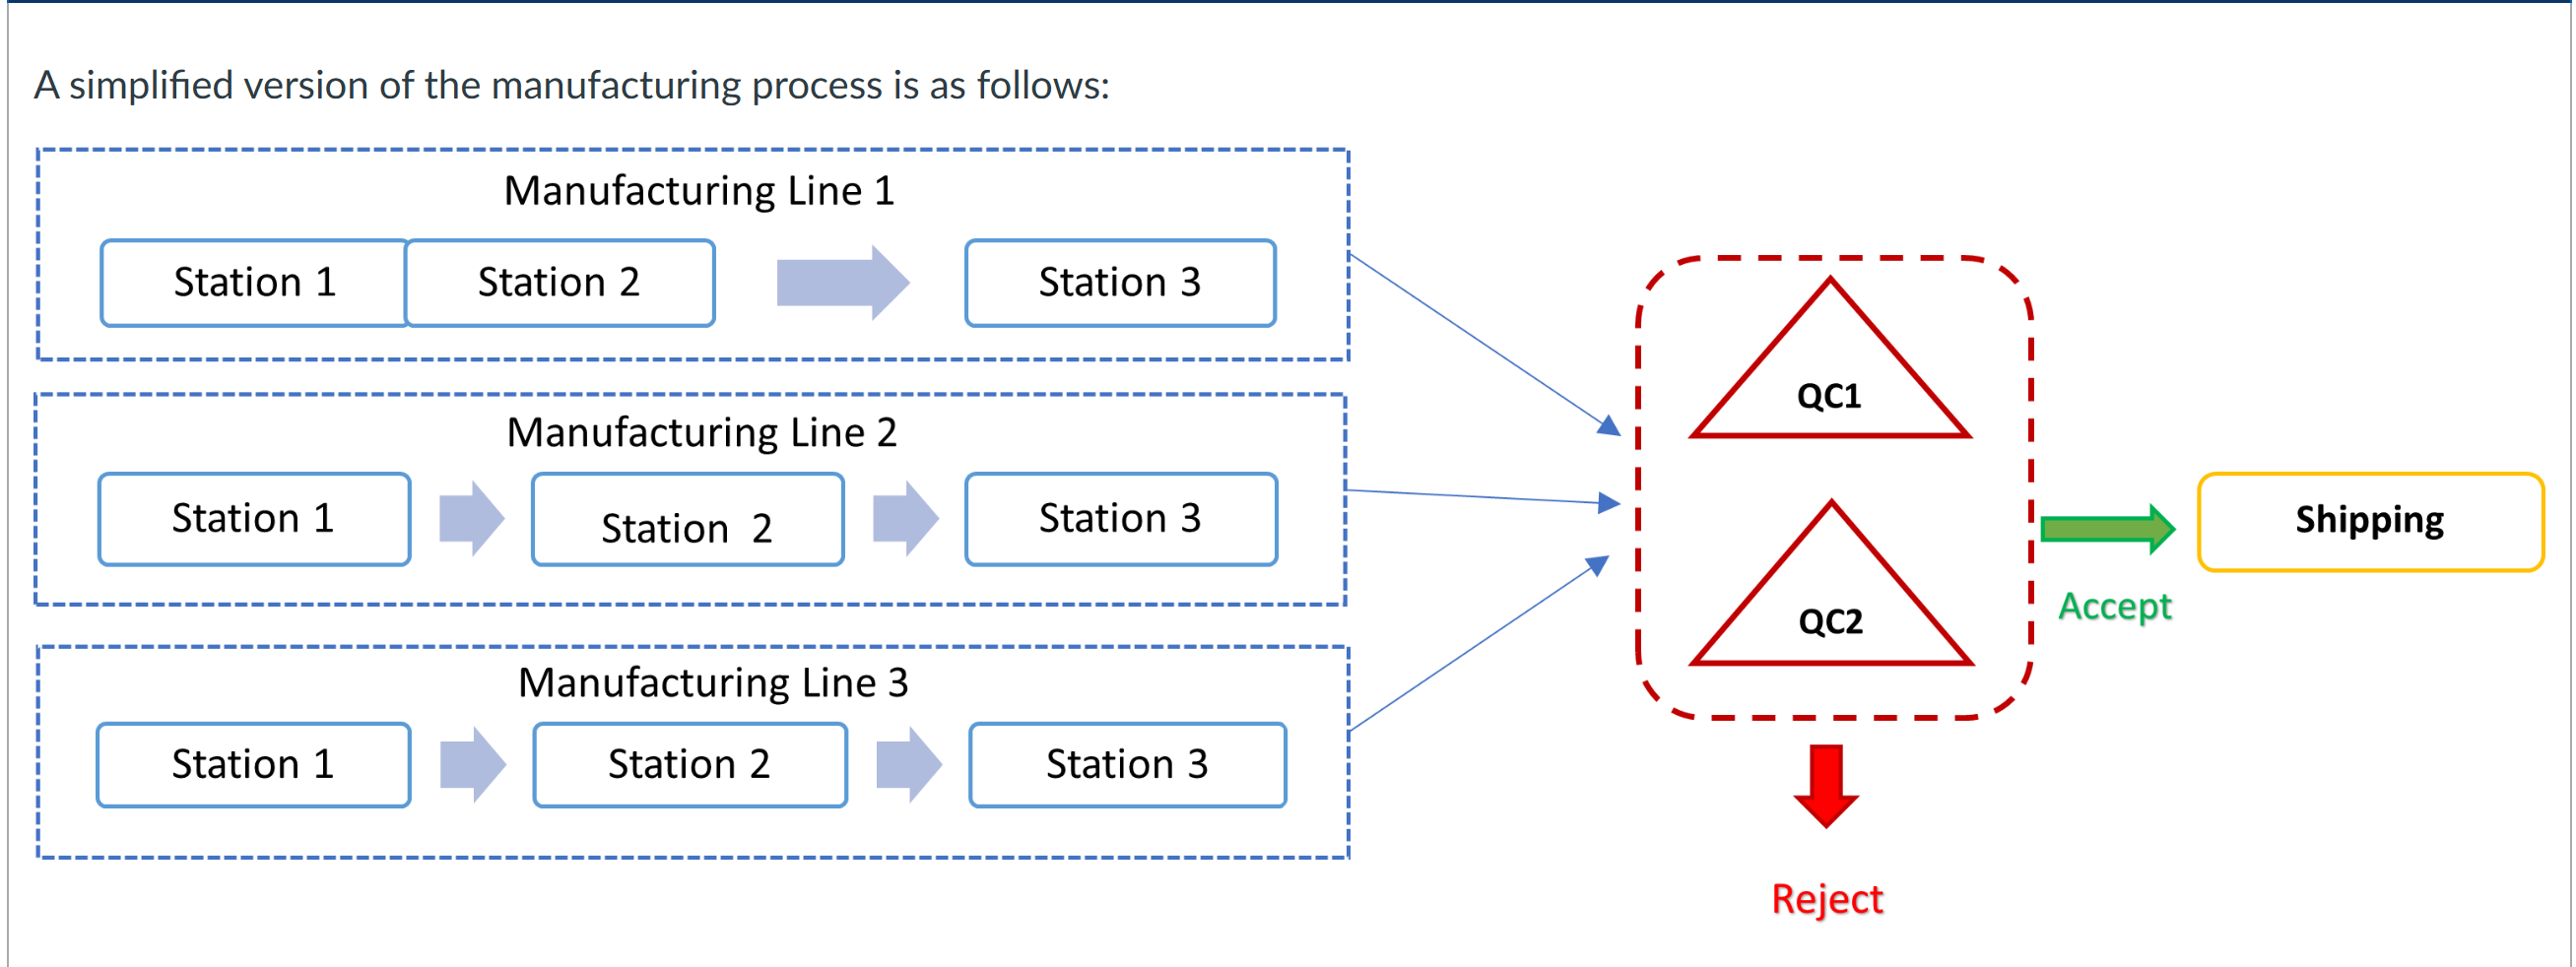
Once a complete drone is produced and tested on each manufacturing line, they are sent to one of two QC stations, where they undergo a final test before packaging and shipment to consumers.
Please proceed to the Manufacturing Process section.
So just to be clear, you are asked to develop two specific simulation models for this task:
A baseline simulation of the existing process as depicted with Manufacturing Lines and stations on each line as well as QC stations and ultimately a shipping process
An alternative model where ONE of the manufacturing lines has increased production speed each station essentially by
Your models will need elements to create widgets before each ML line, process elements for each station including a shipping station, and then ultimately a sinkdispose for the finished drones.
USE Arena Simulation to indicate model
You will need to make some assumptions in terms of the processing times for each station ML & QC failure rates, etc. Feel free to use the data from the process analysis project in terms of means, standard deviations, etc. and use Normal distributions for randomization here.
Your analysis should include metrics like processing times, queue lengths, total manufactured, delaysbottlenecks etc. Really like the process analysis project you already did and analyzed
Once you have a baseline of the described process developed within Arena, run an alternative simulation where one of the manufacturing lines is replaced with a 'high speed' variant, which cuts manufacturing time down by Determine the impact of the single improved manufacturing line on the overall process.
Describe your overall approach to developing and analyzing the simulation models. Then, provide screenshots, descriptions of your models, and information on your statistical distributions and decision point logic. Present summary results and recommendations based on the outputs of your baseline and alternative faster single production line simulation models.
A simplified version of the manufacturing process is as follows:
Manufacturing Line
Manufacturing Line
Manufacturing Line

Step by Step Solution
There are 3 Steps involved in it
Step: 1

Get Instant Access to Expert-Tailored Solutions
See step-by-step solutions with expert insights and AI powered tools for academic success
Step: 2

Step: 3

Ace Your Homework with AI
Get the answers you need in no time with our AI-driven, step-by-step assistance
Get Started


