

Question
you work for a private wealth management firm that follows an external investment model whereby it decides which outside managers it should recommend to clients.
you work for a private wealth management firm that follows an external investment model whereby it decides which outside managers it should recommend to clients. one mutual fund that is a candidate for inclusion on your premier recommended list of approved managers is active fund (AFNDX) an actively managed stock portfolio benchmark to the standard and poors 500 (SPX) index. you have been asked to perform an evaluation of a AFNDX's past investment performance using a sample of monthly returns on the following positions: (1) AFNDX (2) SPX index (3) us treasury bills and (4) the three primary fama French risk factors ( excess market, SMB, HML) THESE DATA ARE LISTED BELOW.
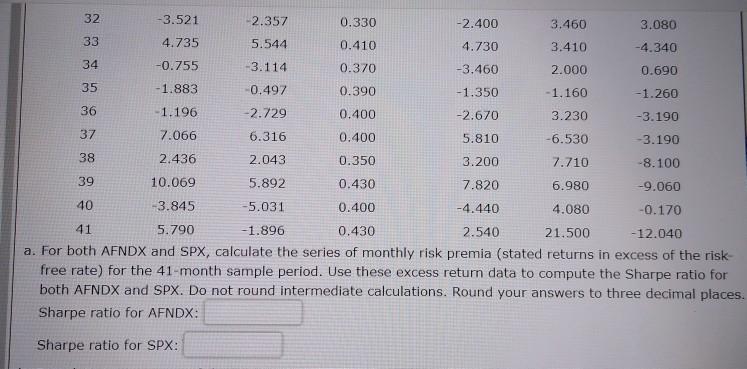
A) for both AFNDX and SPX calculate the series of monthly risk premia (stated returns and excess of the risk-free rate) for the 41-month sample period. use these excess return data to compute the Sharpe ratio for both AFNDX and SPX. do not round intermediate calculations period round your answers to three decimal places.
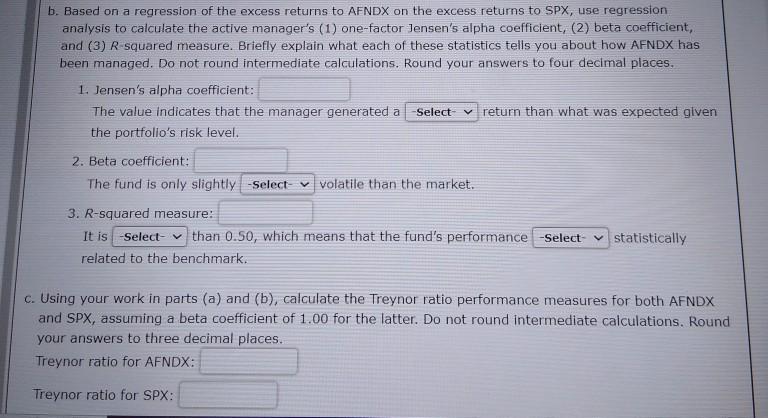
B) based on a regression of the excess returns to AFNDX on the excess returns to SPX, use regression analysis to calculate the active managers one factor Jensen's alpha coefficient, beta coefficient, and R-squared measure.
C) using your work in parts A and B calculated the Treynor ratio performance measures for both AFNDX and SPX, assuming a beta coefficient of one for the latter. do not round intermediate calculations period round your answers to three decimal places.
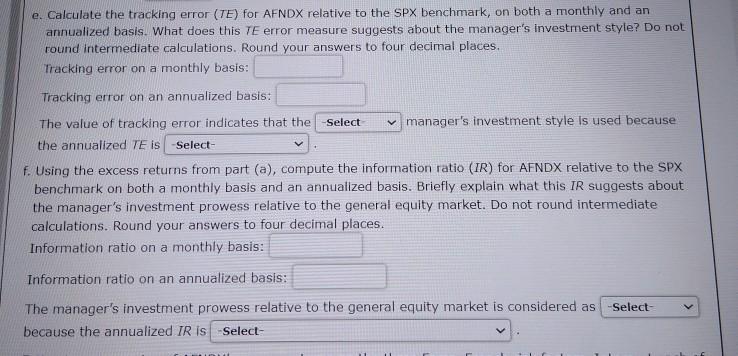
E) calculate the tracking error for AFNDX relative to the SPX benchmark on both a monthly and an annualized basis. what does the tracking error measure suggests about managers investment style? do not round intermediate calculations. round your answers to four decimal places
F) using the excess returns from part A compute the information ratio for AFNDX relative to the SPX benchmark on both a monthly basis and an annualized basis. do not round intermediate calculations. round your answers to four decimal places.
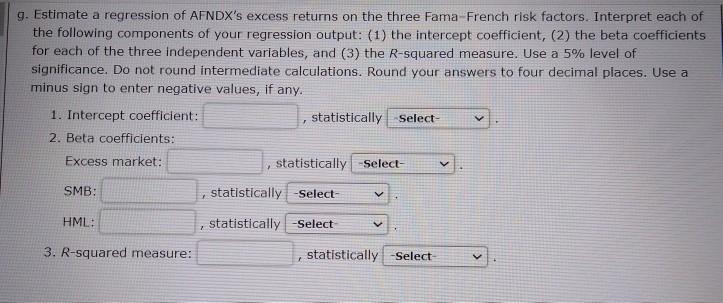
G) estimate a regression of AFNDX excess returns on the three fama French risk factors. interpret each of the following components of your regression output: (1) The intercept coefficient (2) the beta coefficients for each of the three independent variables and (3) the R squared measure. use a 5% level of significance. do not run intermediate calculations period round your answers to four decimal places. use a minus sign to enter negative values.
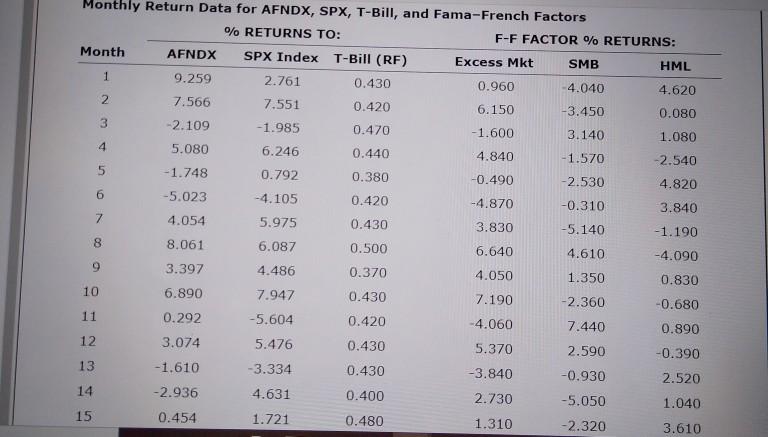
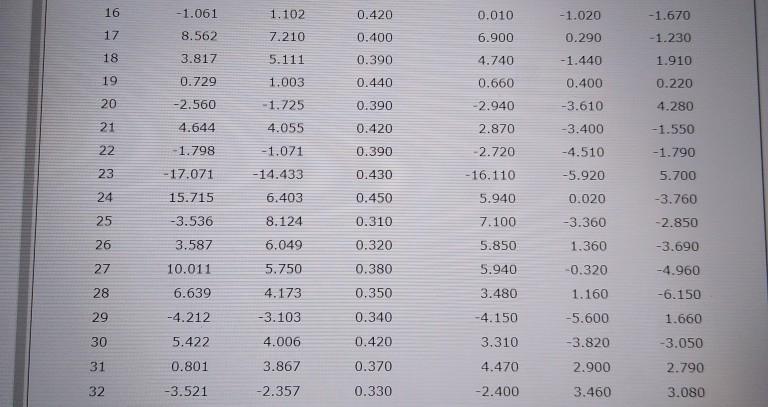
Monthly Return Data for AFNDX, SPX, T-Bill, and Fama-French Factors % RETURNS TO: F-F FACTOR % RETURNS: Month AFNDX SPX Index T-Bill (RF) Excess Mkt SMB HML 1 9.259 2.761 0.430 0.960 4.040 4.620 2 7.566 7.551 0.420 6.150 -3.450 0.080 3 -2.109 -1.985 0.470 -1.600 3.140 1.080 4 5.080 6.246 0.440 4.840 -1.570 -2.540 5 -1.748 0.792 0.380 -0.490 -2.530 4.820 6 -5.023 -4.105 0.420 -4.870 -0.310 3.840 7 4.054 5.975 0.430 3.830 -5.140 -1.190 8 8.061 6.087 0.500 6.640 4.610 -4.090 9 3.397 4.486 0.370 4.050 1.350 0.830 10 6.890 7.947 0.430 7.190 -2.360 -0.680 11 0.292 -5.604 0.420 -4.060 7.440 0.890 12 3.074 5.476 0.430 5.370 2.590 -0.390 13 -1.610 -3.334 0.430 -3.840 -0.930 2.520 14 -2.936 4.631 0.400 2.730 -5.050 1.040 15 0.454 1.721 0.480 1.310 -2.320 3.610 16 -1.051 0.420 0.010 -1.020 -1.570 1,192 7210 17 8.56 0.400 6.900 0.290 -120 18 3.817 5.111 0.301) 4.740 -1.440 1910 19 0.729 1.003 0440 10. fbb01 0.400 0.220 4.280 20 -2.560 -1.725 0390 3.610 2.940 2.870 21 4.644 4.055 0.420 0.00 1.550 -1.90 22 198 2.720 -3.400 -4.510 -5.920 23 -1.071 -14.433 6.403 -17.071 0430 -16.110 5.700 -3.750 24 15.715 0.450 5940 0.020 25 -3.536 8.124 0.116 7.100 -3.360 26 3.587 6.049 0.320 5.850 1.350 27 5,750 0.380 5.940 -0.320 2.850 3.690 -4.960 -6.150 1.660 10.011 6.639 -4.212 28 4,173 0.350 3.480 1.160 5.600 29 3.103 -4.150 0.340 0.420 5.422 4,006 3.310 -3.820 -3.050 30 1 0.801 3.867 0.370 4.470 2.900 2.790 32 -3.521 -2.357 0.330 -2.400 3.460 3.08 32 -3.521 -2.357 0.330 -2.400 3.460 3.080 33 4.735 5.544 0.410 4.730 3.410 -4.340 34 -0.755 -3.114 0.370 -3.460 2.000 0.690 35 -1.883 0.497 0.390 -1.350 - 1.160 -1.260 36 -1.196 -2.729 0.400 -2.670 3.230 -3.190 37 7.066 6.316 0.400 5.810 -6.530 -3.190 38 2.436 2.043 0.350 3.200 7.710 -8.100 39 10.069 5.892 0.430 7.820 6.980 -9.060 40 -3.845 -5.031 0.400 -4.440 4.080 -0.170 41 5.790 -1.896 0.430 2.540 21.500 -12.040 a. For both AFNDX and SPX, calculate the series of monthly risk premia (stated returns in excess of the risk free rate) for the 41-month sample period. Use these excess return data to compute the Sharpe ratio for both AFNDX and SPX. Do not round intermediate calculations. Round your answers to three decimal places. Sharpe ratio for AFNDX: Sharpe ratio for SPX: b. Based on a regression of the excess returns to AFNDX on the excess returns to SPX, use regression analysis to calculate the active manager's (1) one-factor Jensen's alpha coefficient, (2) beta coefficient, and (3) R-squared measure. Briefly explain what each of these statistics tells you about how AFNDX has been managed. Do not round intermediate calculations. Round your answers to four decimal places, 1. Jensen's alpha coefficient: The value indicates that the manager generated a Select y return than what was expected given the portfolio's risk level. 2. Beta coefficient: The fund is only slightly -Select- volatile than the market. 3. R-squared measure: It is -Select-than 0.50, which means that the fund's performance -Select statistically related to the benchmark. c. Using your work in parts (a) and (b), calculate the Treynor ratio performance measures for both AFNDX and SPX, assuming a beta coefficient of 1.00 for the latter. Do not round intermediate calculations. Round your answers to three decimal places. Treynor ratio for AFNDX: Treynor ratio for SPX: e. Calculate the tracking error (TE) for AFNDX relative to the SPX benchmark, on both a monthly and an annualized basis. What does this TE error measure suggests about the manager's Investment style? Do not round Intermediate calculations. Round your answers to four decimal places. Tracking error on a monthly basis: Tracking error on an annualized basis: V The value of tracking error indicates that the Select v manager's investment style is used because the annualized TE is Select- f. Using the excess returns from part (a), compute the information ratio (IR) for AFNDX relative to the SPX benchmark on both a monthly basis and an annualized basis. Briefly explain what this IR suggests about the manager's investment prowess relative to the general equity market. Do not round intermediate calculations. Round your answers to four decimal places. Information ratio on a monthly basis: Information ratio on an annualized basis: The manager's investment prowess relative to the general equity market is considered as Select- because the annualized IR Is Select- g. Estimate a regression of AFNDX's excess returns on the three Fama French risk factors. Interpret each of the following components of your regression output: (1) the intercept coefficient, (2) the beta coefficients for each of the three independent variables, and (3) the R-squared measure. Use a 5% level of significance. Do not round intermediate calculations. Round your answers to four decimal places. Use a minus sign to enter negative values, if any. 1. Intercept coefficient: statistically Select- 2. Beta coefficients: Excess market: statistically Select- ? SMB: 1 statistically -Select- V HML: statistically -Select 3. R-squared measure: statistically -Select- Monthly Return Data for AFNDX, SPX, T-Bill, and Fama-French Factors % RETURNS TO: F-F FACTOR % RETURNS: Month AFNDX SPX Index T-Bill (RF) Excess Mkt SMB HML 1 9.259 2.761 0.430 0.960 4.040 4.620 2 7.566 7.551 0.420 6.150 -3.450 0.080 3 -2.109 -1.985 0.470 -1.600 3.140 1.080 4 5.080 6.246 0.440 4.840 -1.570 -2.540 5 -1.748 0.792 0.380 -0.490 -2.530 4.820 6 -5.023 -4.105 0.420 -4.870 -0.310 3.840 7 4.054 5.975 0.430 3.830 -5.140 -1.190 8 8.061 6.087 0.500 6.640 4.610 -4.090 9 3.397 4.486 0.370 4.050 1.350 0.830 10 6.890 7.947 0.430 7.190 -2.360 -0.680 11 0.292 -5.604 0.420 -4.060 7.440 0.890 12 3.074 5.476 0.430 5.370 2.590 -0.390 13 -1.610 -3.334 0.430 -3.840 -0.930 2.520 14 -2.936 4.631 0.400 2.730 -5.050 1.040 15 0.454 1.721 0.480 1.310 -2.320 3.610 16 -1.051 0.420 0.010 -1.020 -1.570 1,192 7210 17 8.56 0.400 6.900 0.290 -120 18 3.817 5.111 0.301) 4.740 -1.440 1910 19 0.729 1.003 0440 10. fbb01 0.400 0.220 4.280 20 -2.560 -1.725 0390 3.610 2.940 2.870 21 4.644 4.055 0.420 0.00 1.550 -1.90 22 198 2.720 -3.400 -4.510 -5.920 23 -1.071 -14.433 6.403 -17.071 0430 -16.110 5.700 -3.750 24 15.715 0.450 5940 0.020 25 -3.536 8.124 0.116 7.100 -3.360 26 3.587 6.049 0.320 5.850 1.350 27 5,750 0.380 5.940 -0.320 2.850 3.690 -4.960 -6.150 1.660 10.011 6.639 -4.212 28 4,173 0.350 3.480 1.160 5.600 29 3.103 -4.150 0.340 0.420 5.422 4,006 3.310 -3.820 -3.050 30 1 0.801 3.867 0.370 4.470 2.900 2.790 32 -3.521 -2.357 0.330 -2.400 3.460 3.08 32 -3.521 -2.357 0.330 -2.400 3.460 3.080 33 4.735 5.544 0.410 4.730 3.410 -4.340 34 -0.755 -3.114 0.370 -3.460 2.000 0.690 35 -1.883 0.497 0.390 -1.350 - 1.160 -1.260 36 -1.196 -2.729 0.400 -2.670 3.230 -3.190 37 7.066 6.316 0.400 5.810 -6.530 -3.190 38 2.436 2.043 0.350 3.200 7.710 -8.100 39 10.069 5.892 0.430 7.820 6.980 -9.060 40 -3.845 -5.031 0.400 -4.440 4.080 -0.170 41 5.790 -1.896 0.430 2.540 21.500 -12.040 a. For both AFNDX and SPX, calculate the series of monthly risk premia (stated returns in excess of the risk free rate) for the 41-month sample period. Use these excess return data to compute the Sharpe ratio for both AFNDX and SPX. Do not round intermediate calculations. Round your answers to three decimal places. Sharpe ratio for AFNDX: Sharpe ratio for SPX: b. Based on a regression of the excess returns to AFNDX on the excess returns to SPX, use regression analysis to calculate the active manager's (1) one-factor Jensen's alpha coefficient, (2) beta coefficient, and (3) R-squared measure. Briefly explain what each of these statistics tells you about how AFNDX has been managed. Do not round intermediate calculations. Round your answers to four decimal places, 1. Jensen's alpha coefficient: The value indicates that the manager generated a Select y return than what was expected given the portfolio's risk level. 2. Beta coefficient: The fund is only slightly -Select- volatile than the market. 3. R-squared measure: It is -Select-than 0.50, which means that the fund's performance -Select statistically related to the benchmark. c. Using your work in parts (a) and (b), calculate the Treynor ratio performance measures for both AFNDX and SPX, assuming a beta coefficient of 1.00 for the latter. Do not round intermediate calculations. Round your answers to three decimal places. Treynor ratio for AFNDX: Treynor ratio for SPX: e. Calculate the tracking error (TE) for AFNDX relative to the SPX benchmark, on both a monthly and an annualized basis. What does this TE error measure suggests about the manager's Investment style? Do not round Intermediate calculations. Round your answers to four decimal places. Tracking error on a monthly basis: Tracking error on an annualized basis: V The value of tracking error indicates that the Select v manager's investment style is used because the annualized TE is Select- f. Using the excess returns from part (a), compute the information ratio (IR) for AFNDX relative to the SPX benchmark on both a monthly basis and an annualized basis. Briefly explain what this IR suggests about the manager's investment prowess relative to the general equity market. Do not round intermediate calculations. Round your answers to four decimal places. Information ratio on a monthly basis: Information ratio on an annualized basis: The manager's investment prowess relative to the general equity market is considered as Select- because the annualized IR Is Select- g. Estimate a regression of AFNDX's excess returns on the three Fama French risk factors. Interpret each of the following components of your regression output: (1) the intercept coefficient, (2) the beta coefficients for each of the three independent variables, and (3) the R-squared measure. Use a 5% level of significance. Do not round intermediate calculations. Round your answers to four decimal places. Use a minus sign to enter negative values, if any. 1. Intercept coefficient: statistically Select- 2. Beta coefficients: Excess market: statistically Select- ? SMB: 1 statistically -Select- V HML: statistically -Select 3. R-squared measure: statistically -SelectStep by Step Solution
There are 3 Steps involved in it
Step: 1

Get Instant Access to Expert-Tailored Solutions
See step-by-step solutions with expert insights and AI powered tools for academic success
Step: 2

Step: 3
Ace Your Homework with AI
Get the answers you need in no time with our AI-driven, step-by-step assistance
Get Started
Personal Finance
Authors: Jack Kapoor, Les Dlabay, Robert J. Hughes, Arshad Ahmad, Jordan Fortino
7th Canadian Edition
1259650650, 978-1259650659