Question
You work for an organization that provides loans to businesses. You are working with a client who is requesting a loan that will require a
You work for an organization that provides loans to businesses. You are working with a client who is requesting a loan that will require a review of financial and related performance documents. You have been asked to review the documents and summarize your findings in a loan recommendation for your management team.
You are a loan manager for a lending organization, and your responsibilities include reviewing loan requests and providing recommendations in regard to whether the loan requests should be funded.
Your client works for Ace Company. Assume Ace Company requested a $3 million 10-year loan to purchase production equipment and develop accompanying software.
The Ace Company Data document provided in the Resources contains financial statements for Ace Company.
Loan Recommendation
To arrive at your recommendation, analyze the financial performance of the requesting company and present it to your organizations upper-management team. The management team will take your recommendation into consideration as they finalize loan requests.
Analyze the company's performance and performance trends. Include the following in your analysis:
- Analyze the trend for accounts receivable collections.
- Identify the trend.
- Explain the relevance of the trend.
- Determine if the trend is improving or getting worse.
- Compare the company's average inventory turnover to the industry average inventory turnover rate. Note that the average industry turnover rate for Ace Company is 10 times per year.
- Consider whether the companys average inventory turnover is higher or lower than the industry average.
- Explain whether a higher or lower average is better.
- Determine whether the trend is improving or getting worse.
- Evaluate the company's short-term and long-term credit worthiness based on financial performance and trend (comparing this year to last year). Include in your evaluation:
- Information about performance and trends.
- Information about other relevant financial information you consider important to the decision.
- Your recommendation regarding whether the bank should grant the loan based on the financial data.
Financial Data


No Industry average ratios were given.
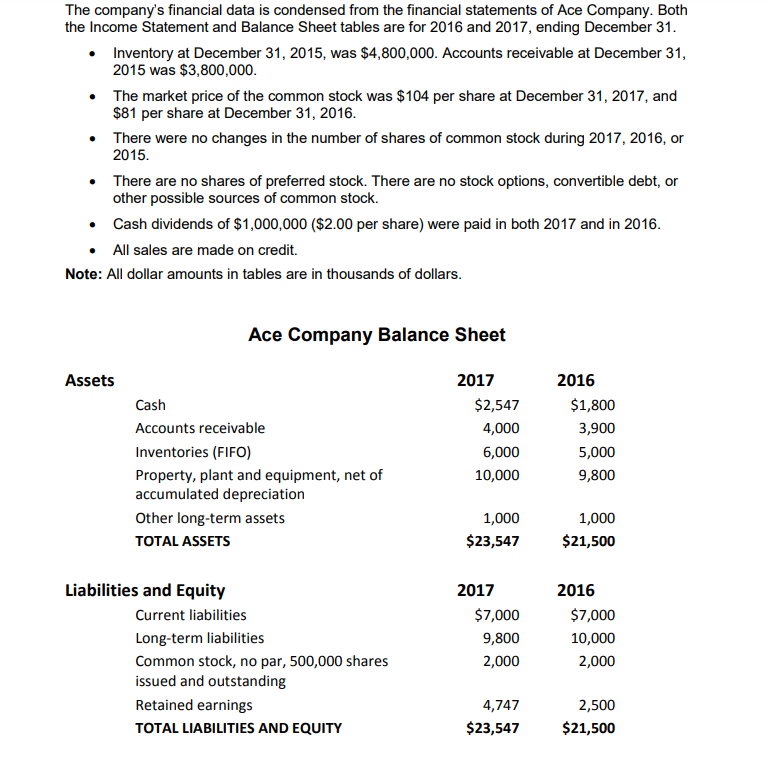
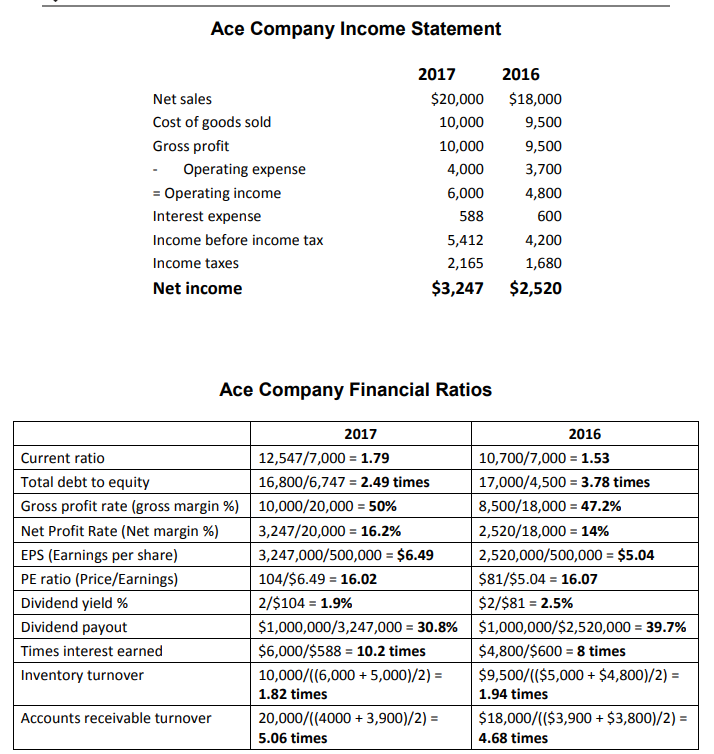
The company's financial data is condensed from the financial statements of Ace Company. Both the Income Statement and Balance Sheet tables are for 2016 and 2017, ending December 31 Inventory at December 31, 2015, was $4,800,000. Accounts receivable at December 31 2015 was $3,800,000 . The market price of the common stock was $104 per share at December 31, 2017, and $81 per share at December 31, 2016 There were no changes in the number of shares of common stock during 2017, 2016, or 2015 There are no shares of preferred stock. There are no stock options, convertible debt, or other possible sources of common stock. . . Cash dividends of $1,000,000 ($2.00 per share) were paid in both 2017 and in 2016 All sales are made on credit. Note: All dollar amounts in tables are in thousands of dollars Ace Company Balance Sheet 2017 2016 Assets $2,547 $1,800 Cash Accounts receivable 4,000 3,900 Inventories (FIFO) 5,000 6,000 Property, plant and equipment, net of accumulated depreciation 9,800 10,000 Other long-term assets 1,000 1,000 $23,547 $21,500 TOTAL ASSETS 2017 2016 Liabilities and Equity $7,000 $7,000 Current liabilities Long-term liabilities 9,800 10,000 Common stock, no par, 500,000 shares issued and outstanding 2,000 2,000 Retained earnings 4,747 2,500 $23,547 $21,500 TOTAL LIABILITIES AND EQUITY Ace Company Income Statement 2017 2016 $20,000 $18,000 Net sales Cost of goods sold 10,000 9,500 Gross profit 10,000 9,500 3,700 -Operating expense 4,000 -Operating income 6,000 4,800 600 Interest expense 588 Income before income ta:x 5,412 4,200 Income taxes 2,165 1,680 $3,247 $2,520 Net income Ace Company Financial Ratios 2017 2016 12,547/7,000 1.79 10,700/7,000 1.53 Current ratio Total debt to equity 16,800/6,747 2.49 times 17,000/4,500 3.78 times Gross profit rate (gross margin %) | 10,000/20,000-50% 8,500/18,000 : 47.2% | 3,247/2 3,247,000/500,000 $6.49 Net Profit Rate (Net margin 96) 2,520/18,000 : 14% 0,000 : 16.2% EPS (Earnings per share) 2,520,000/500,000 $5.04 PE ratio (Price/Earnings) $81/$5.04 16.07 104/$6.49 16.02 2/$104-1.9% $2/$81 : 2.5% Dividend yield % $1,000,000/3,247,000-30.8% | $1,000,000/$2,520,000 : 39.7% Dividend payout $6,000/$588 10.2 times Times interest earned $4,800/$600 8 times )-$9,500/($5,000$4,800)/2)- 1.94 times 10,000/((6,0005,000)/2) Inventory turnover 1.82 times 900)/2)$18,000/(($3,900 + $3,800)/2)- Accounts receivable turnover 5.06 times 4.68 timesStep by Step Solution
There are 3 Steps involved in it
Step: 1

Get Instant Access to Expert-Tailored Solutions
See step-by-step solutions with expert insights and AI powered tools for academic success
Step: 2

Step: 3

Ace Your Homework with AI
Get the answers you need in no time with our AI-driven, step-by-step assistance
Get Started


