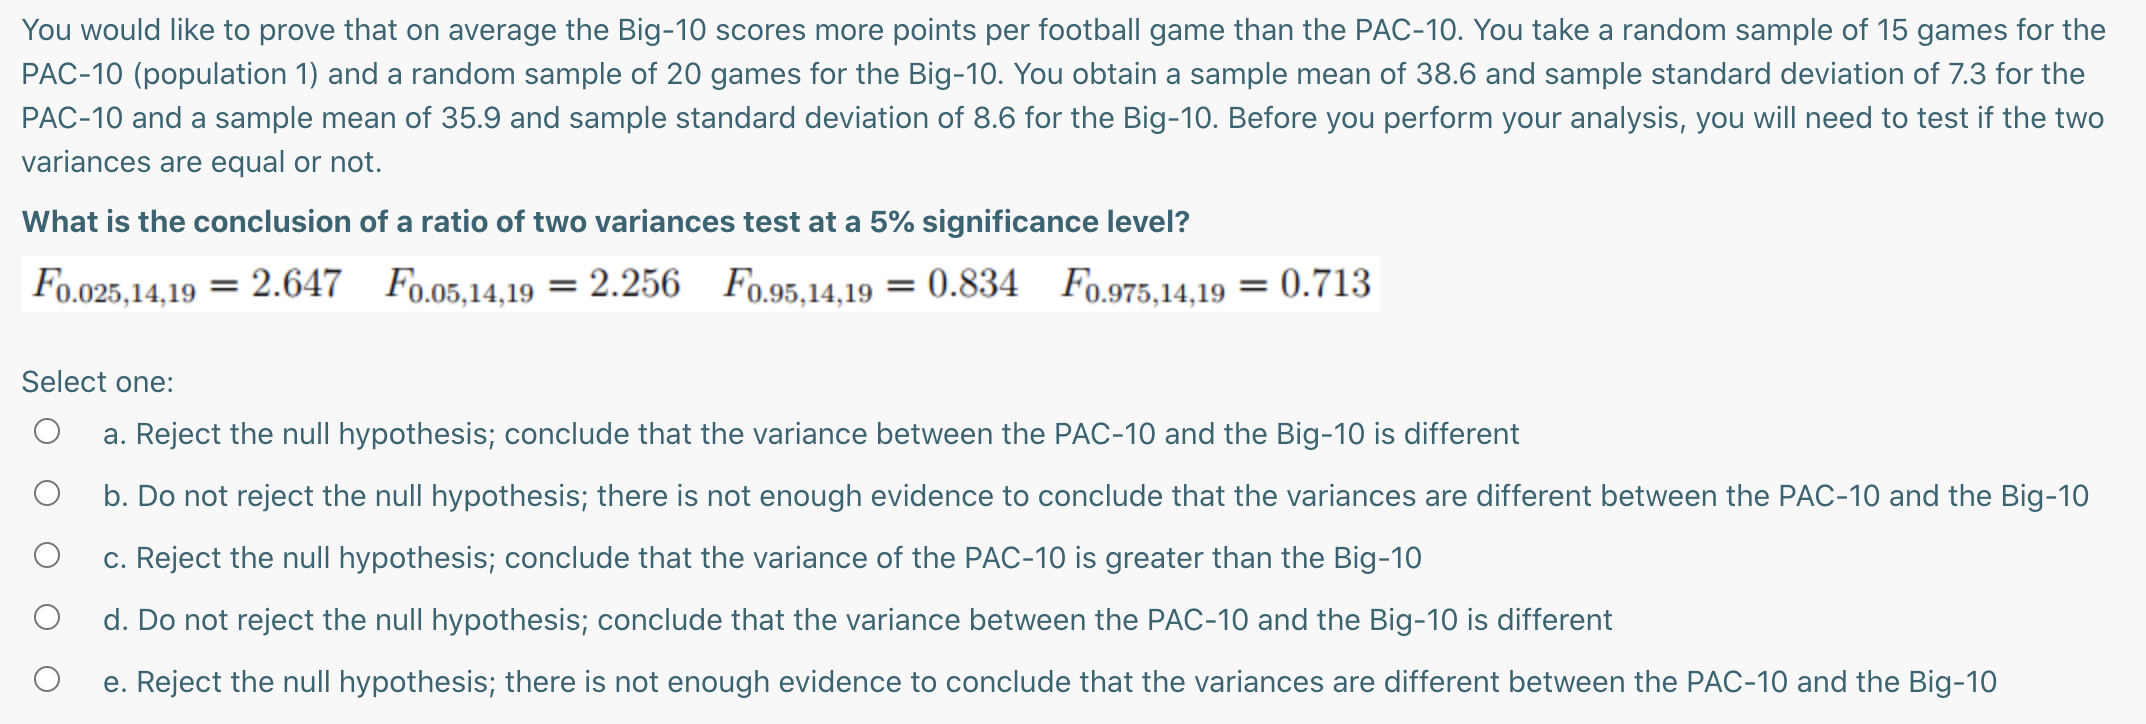
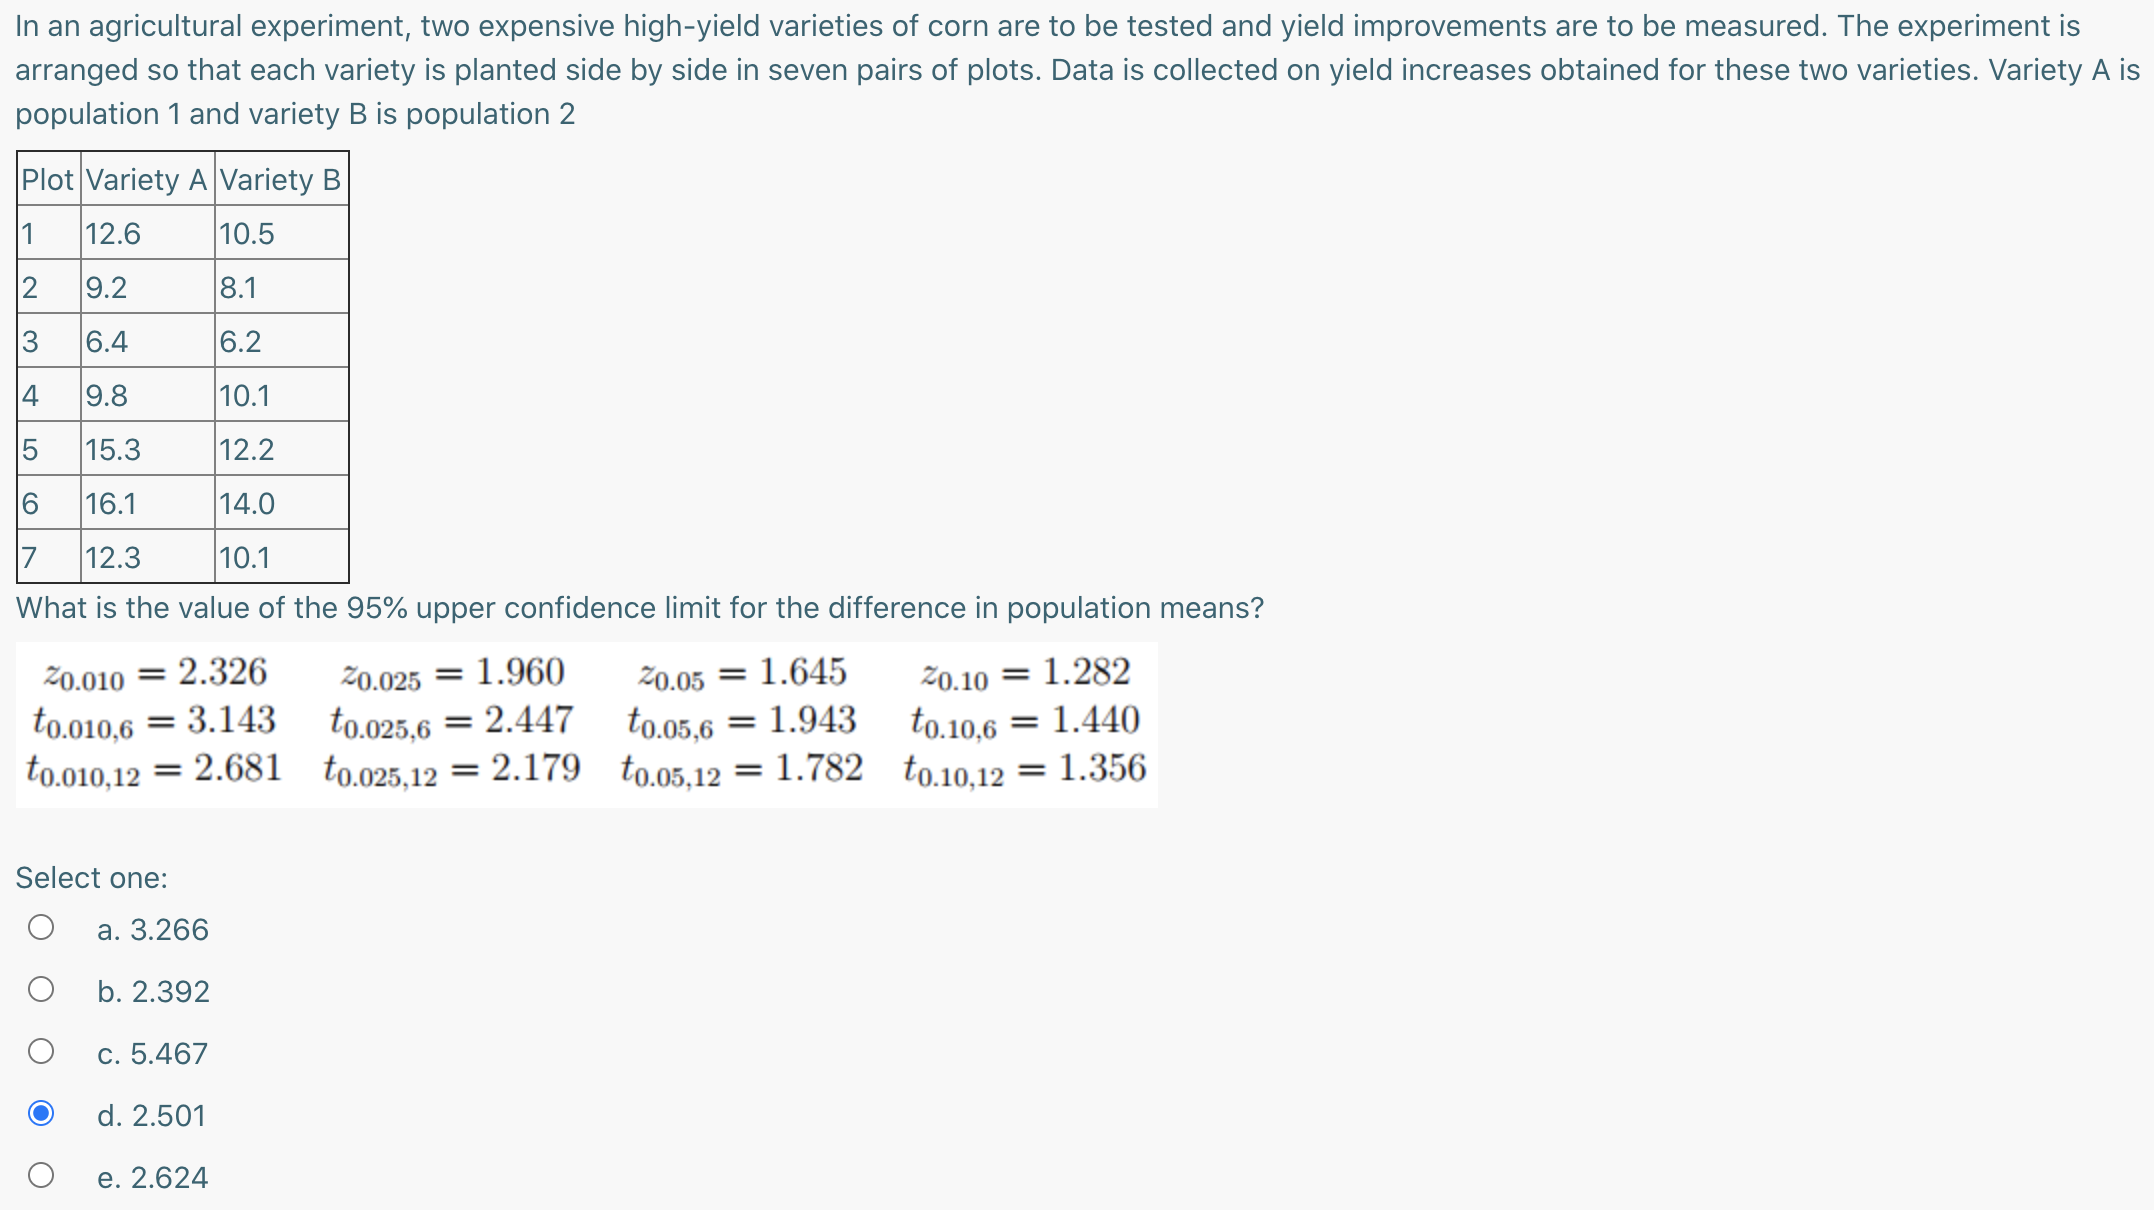
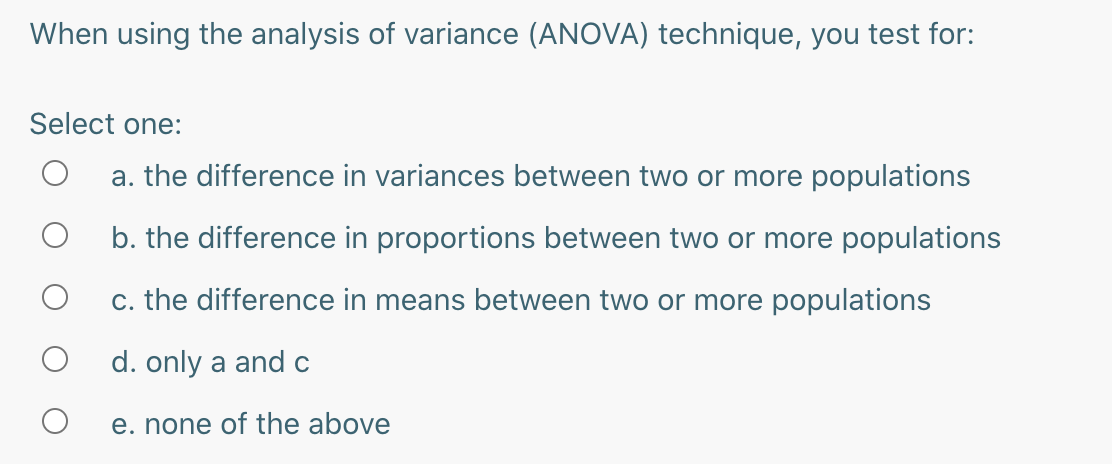
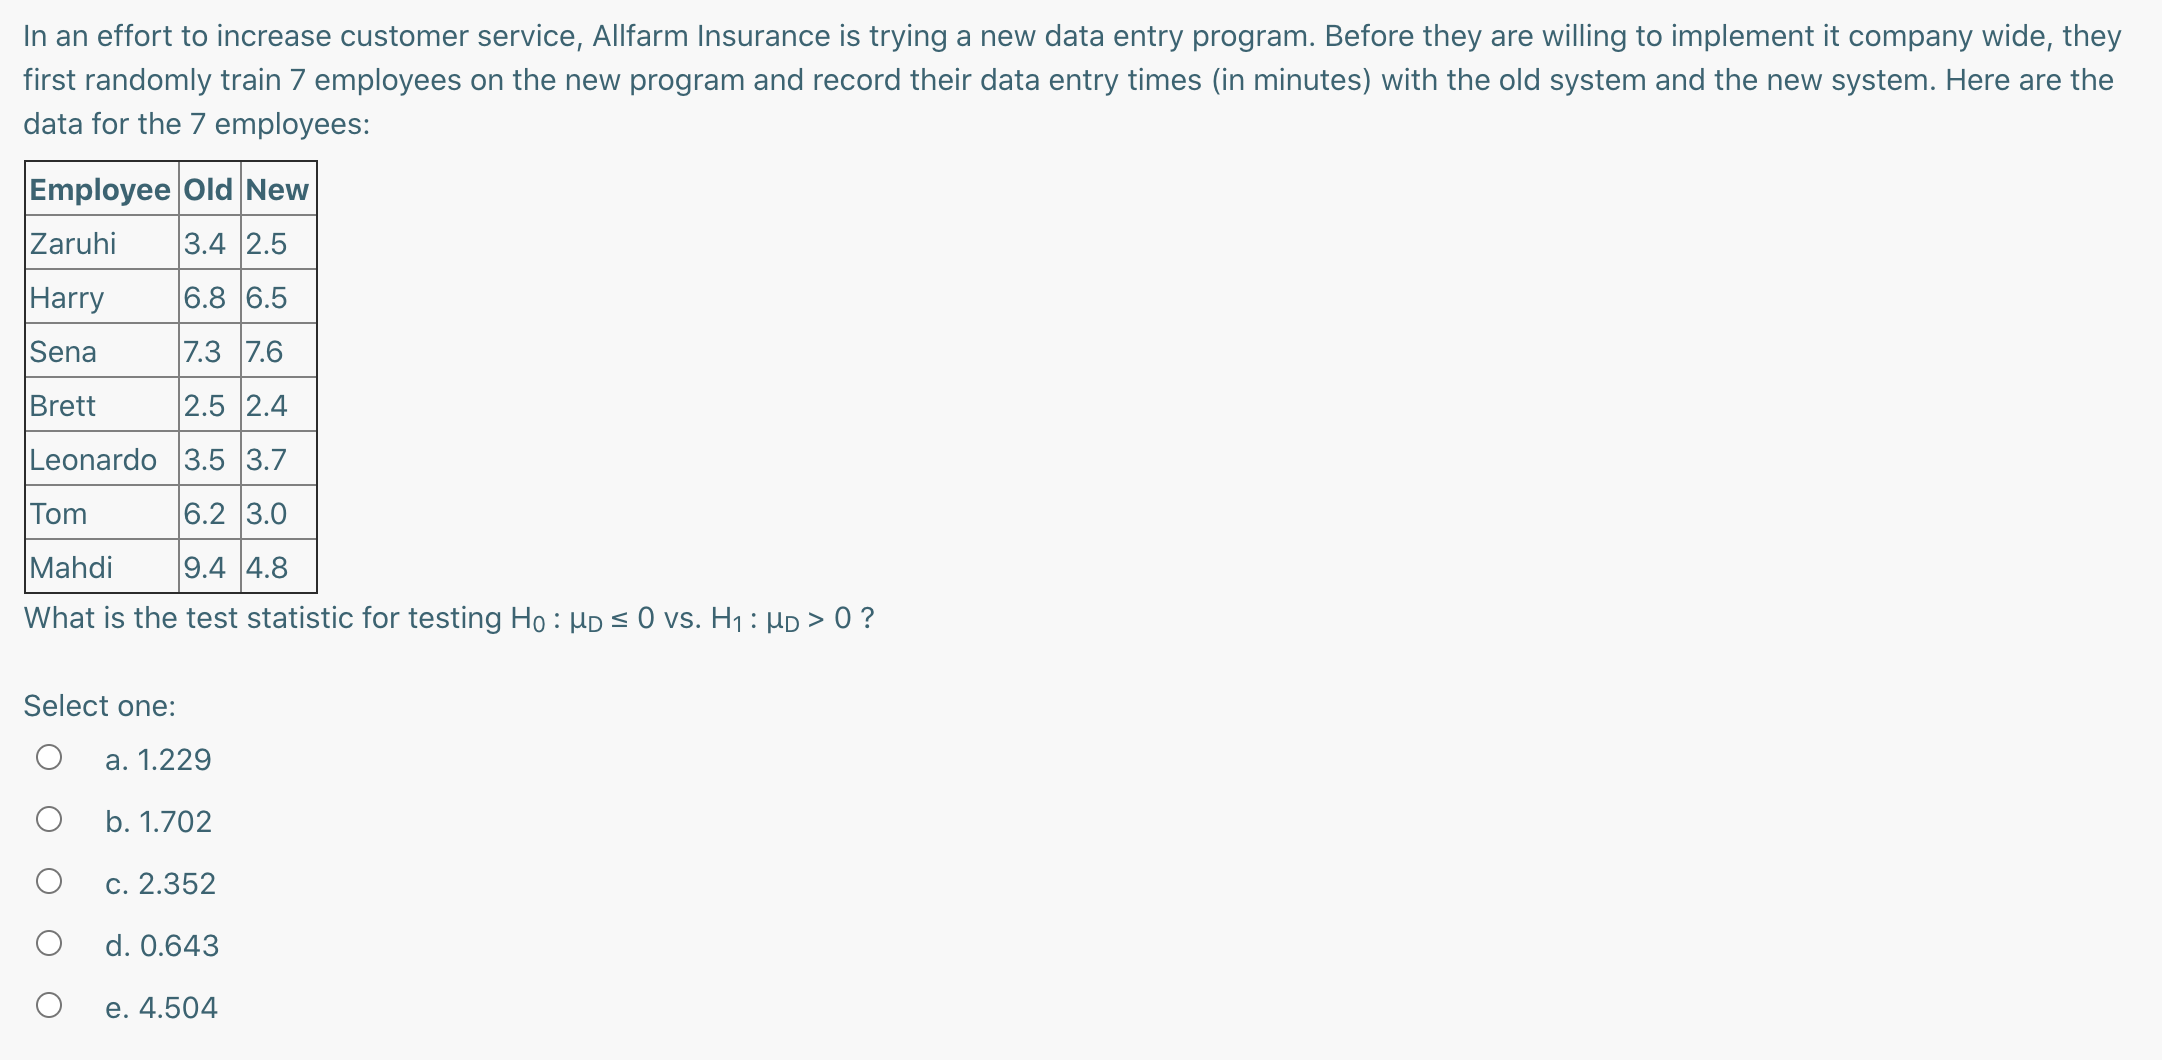
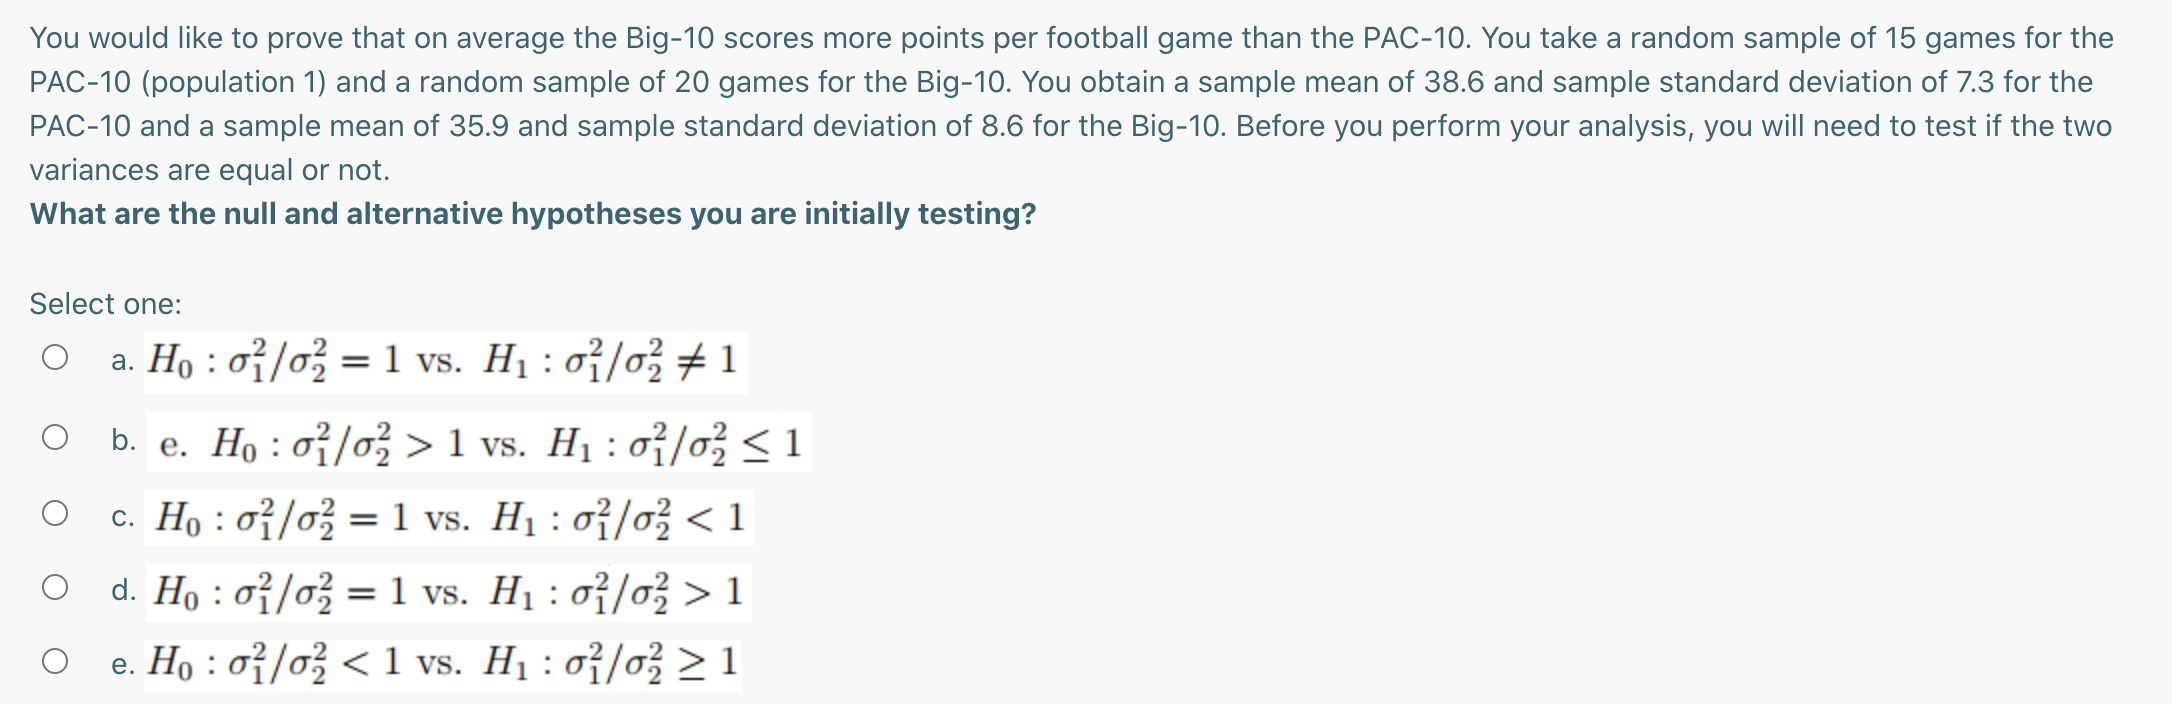
You would like to prove that on average the Big-10 scores more points per football game than the PAC-10. You take a random sample of 15 games for the PAC-10 (population 1) and a random sample of 20 games for the Big-10. You obtain a sample mean of 38.6 and sample standard deviation of 7.3 for the PAC-10 and a sample mean of 35.9 and sample standard deviation of 8.6 for the Big-10. Before you perform your analysis, you will need to test if the two variances are equal or not. What is the conclusion of a ratio of two variances test at a 5% significance level? 1:11.025.14,19 = 2-647 F0.05.14,19 = 2-256 F0.95,l4,19 = 0-834 F0.975,14.19 = 0-713 Select one: O 0000 a. Reject the null hypothesis; conclude that the variance between the PAC-1O and the Big-10 is different b. Do not reject the null hypothesis; there is not enough evidence to conclude that the variances are different between the PAC-10 and the Big-10 c. Reject the null hypothesis; conclude that the variance of the PAC-10 is greater than the Big-10 d. Do not reject the null hypothesis; conclude that the variance between the PAC-1O and the Big-10 is different e. Reject the null hypothesis; there is not enough evidence to conclude that the variances are different between the PAC-'IO and the Big-10 In an agricultural experiment, two expensive high-yield varieties of corn are to be tested and yield improvements are to be measured. The experiment is arranged so that each variety is planted side by side in seven pairs of plots. Data is collected on yield increases obtained for these two varieties. Variety A is population 1 and variety B is population 2 Plot Variety A Variety B 1 12.6 10.5 2 9.2 8.1 3 6.4 6.2 4 9.8 10.1 5 15.3 12.2 6 16.1 14.0 7 12.3 10.1 What is the value of the 95% upper confidence limit for the difference in population means? 20010 = 2.326 20025 = 1.960 20405 = 1.645 2010 = 1.282 to'mo's = 3.143 t0_025'6 = 2.447 t0.05'5 = 1.943 t0.10.6 = 1.440 t0_010'12 = 2.681 t0.025~12 = 2.179 t0'05'12 = 1.782 t0_10'12 = 1.356 Select one: Q a. 3.266 O b. 2.392 O c. 5.467 d. 2.501 0 e. 2624 When using the analysis of variance (ANOVA) technique, you test for: Select one: 0 a. the difference in variances between two or more populations b. the difference in proportions between two or more populations c. the difference in means between two or more populations d. only a and c 0000 e. none of the above In an effort to increase customer service, Allfarm Insurance is trying a new data entry program. Before they are willing to implement it company wide, they first randomly train 7 employees on the new program and record their data entry times (in minutes) with the old system and the new system. Here are the data for the 7 employees: Employee Old New Zaruhi 3.4 2.5 Harry 6.8 6.5 Sena 7.3 7.6 Brett 2.5 2.4 Leonardo 3.5 3.7 Tom 6.2 3.0 Mahdi 9.4 4.8 What is the test statistic for testing Ho: up 5 0 vs. H1 : up > O ? Select one: Q a. 1.229 O b. 1.702 O c. 2.352 Q d. 0.643 0 e. 4.504 You would like to prove that on average the Big-10 scores more points per football game than the PAC-10. You take a random sample of 15 games for the PAC-10 (population 1) and a random sample of 20 games for the Big-10. You obtain a sample mean of 38.6 and sample standard deviation of 7.3 for the PAC-10 and a sample mean of 35.9 and sample standard deviation of 8.6 for the Big-10. Before you perform your analysis, you will need to test if the two variances are equal or not. What are the null and alternative hypotheses you are initially testing? Select one: O a. Ho : 01/02 = 1 vs. H1 : 01/02 # 1 O b. e. Ho : 03/03 > 1 vs. H1 : of/0? 1 O e. Ho : 03 /03