

Answered step by step
Verified Expert Solution
Question
1 Approved Answer
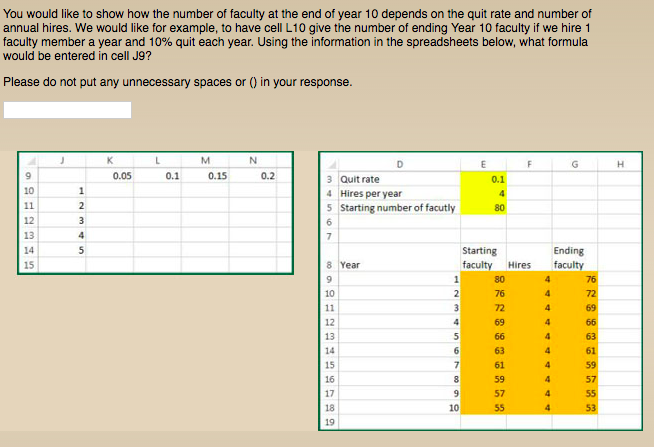
You would like to show how the number of faculty at the end of year 10 depends on the quit rate and number of annual
Step by Step Solution
There are 3 Steps involved in it
Step: 1

Get Instant Access to Expert-Tailored Solutions
See step-by-step solutions with expert insights and AI powered tools for academic success
Step: 2

Step: 3
Ace Your Homework with AI
Get the answers you need in no time with our AI-driven, step-by-step assistance
Get Started
Build It For The Real World A Database Workbook
Authors: Wilson, Susan, Hoferek, Mary J.
1st Edition
0073197599, 9780073197593