

Answered step by step
Verified Expert Solution
Question
1 Approved Answer
You'll be working with the function y = f(x) = (x - 1.5) +2, and the interval you'll always be concerned about is [-2,6].
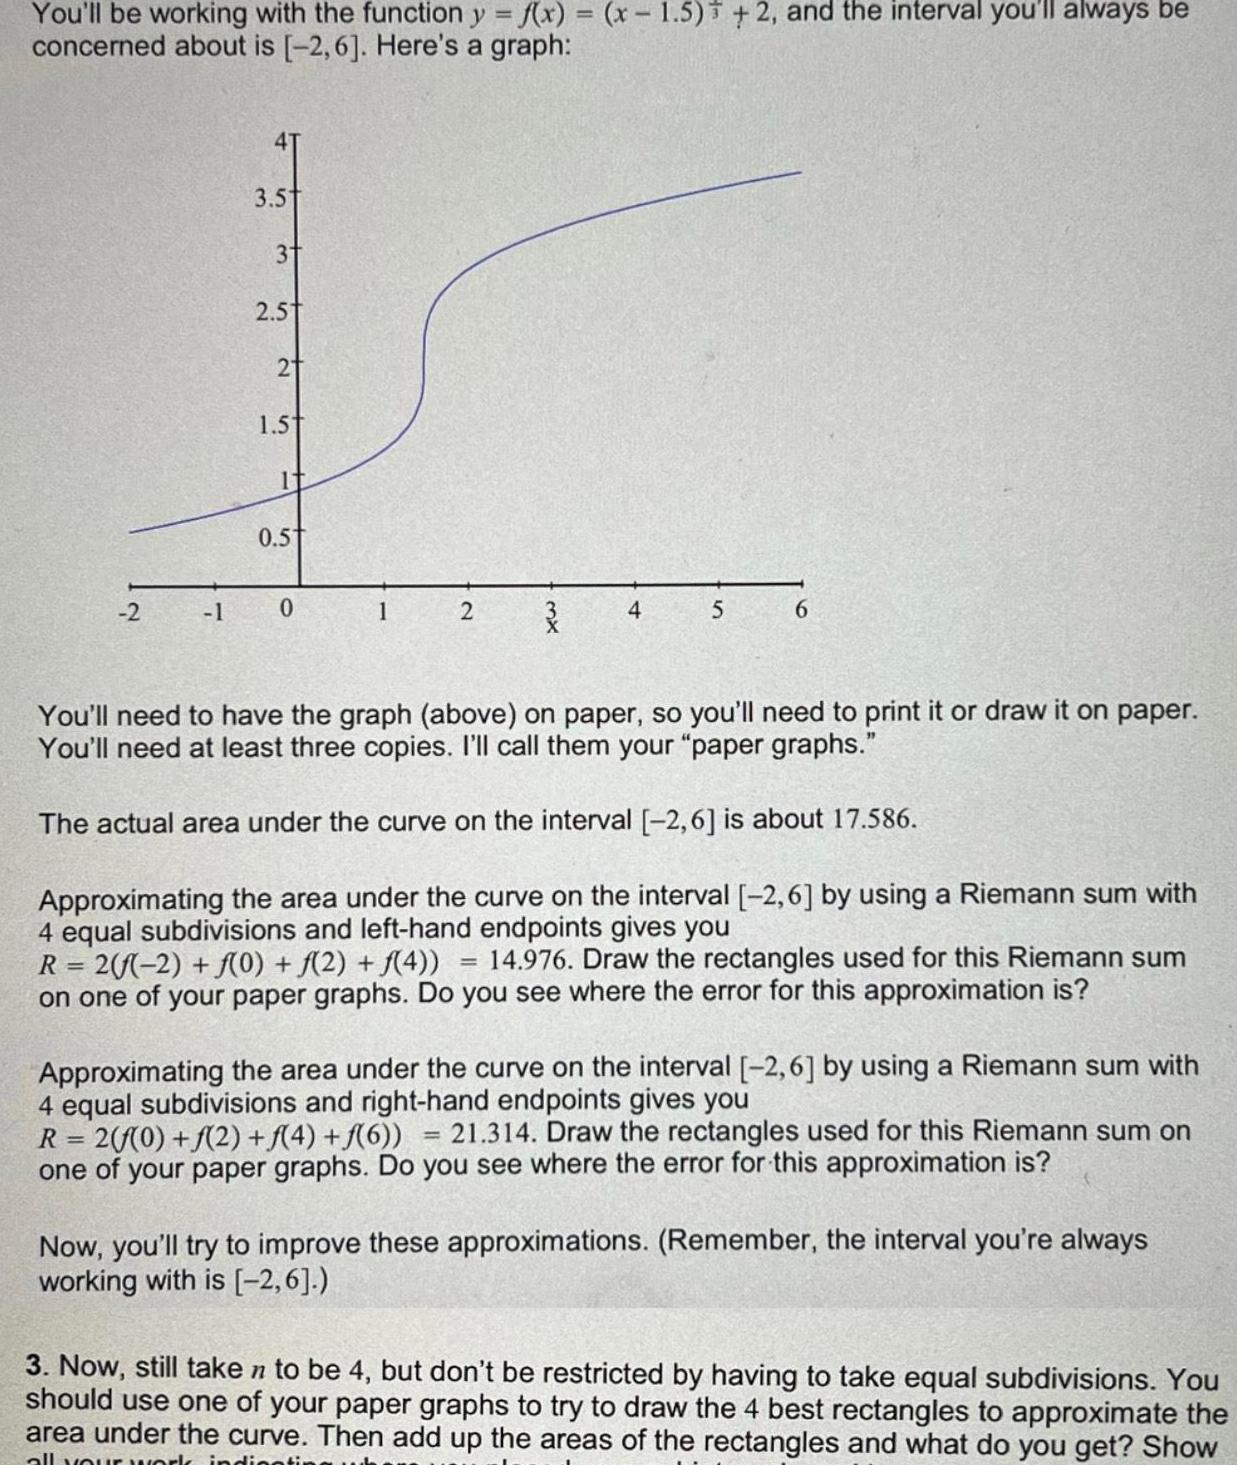
You'll be working with the function y = f(x) = (x - 1.5) +2, and the interval you'll always be concerned about is [-2,6]. Here's a graph: 3.5 31 2.5 21 1.5 0.5 -2 -1 0 1 2 4 5 6 You'll need to have the graph (above) on paper, so you'll need to print it or draw it on paper. You'll need at least three copies. I'll call them your "paper graphs." The actual area under the curve on the interval [-2,6] is about 17.586. Approximating the area under the curve on the interval [-2,6] by using a Riemann sum with 4 equal subdivisions and left-hand endpoints gives you R=2((-2)+f(0) + f(2) + f(4)) = 14.976. Draw the rectangles used for this Riemann sum on one of your paper graphs. Do you see where the error for this approximation is? Approximating the area under the curve on the interval [-2,6] by using a Riemann sum with 4 equal subdivisions and right-hand endpoints gives you = R=2(f(0)+(2) +(4) +(6)) 21.314. Draw the rectangles used for this Riemann sum on one of your paper graphs. Do you see where the error for this approximation is? Now, you'll try to improve these approximations. (Remember, the interval you're always working with is [-2,6].) 3. Now, still take n to be 4, but don't be restricted by having to take equal subdivisions. You should use one of your paper graphs to try to draw the 4 best rectangles to approximate the area under the curve. Then add up the areas of the rectangles and what do you get? Show all your work indicatin
Step by Step Solution
There are 3 Steps involved in it
Step: 1

Get Instant Access to Expert-Tailored Solutions
See step-by-step solutions with expert insights and AI powered tools for academic success
Step: 2

Step: 3
Ace Your Homework with AI
Get the answers you need in no time with our AI-driven, step-by-step assistance
Get Started
Advanced Engineering Mathematics
Authors: A. Ramakrishna Prasad
1st Edition
8126543876, 978-8126543878