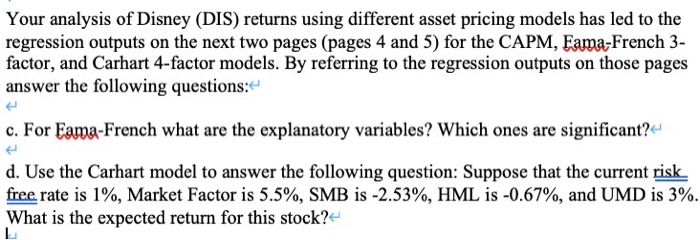
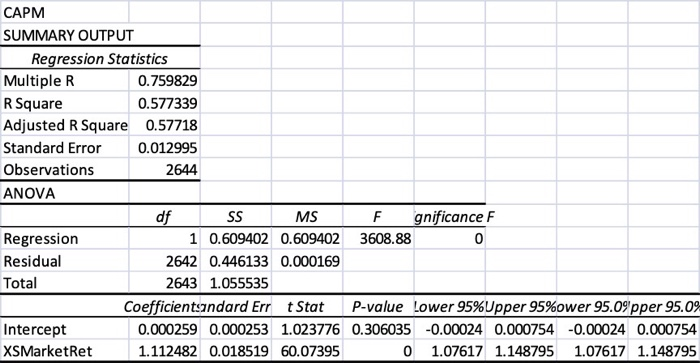
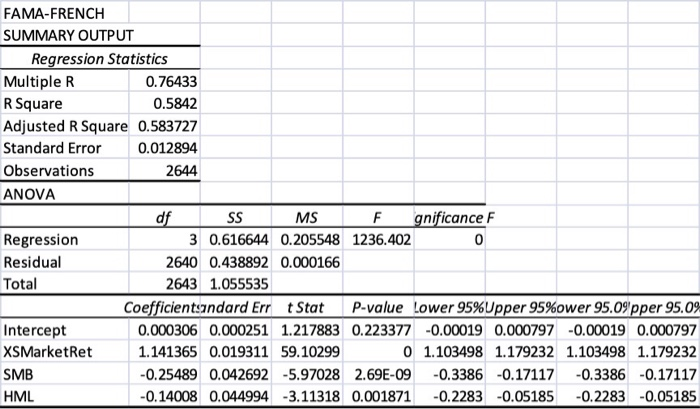
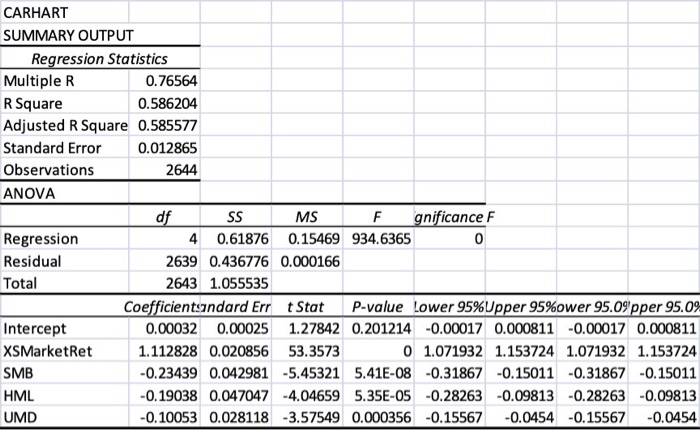
Your analysis of Disney (DIS) returns using different asset pricing models has led to the regression outputs on the next two pages (pages 4 and 5) for the CAPM, Fama-French 3- factor, and Carhart 4-factor models. By referring to the regression outputs on those pages answer the following questions: c. For Fama-French what are the explanatory variables? Which ones are significant? d. Use the Carhart model to answer the following question: Suppose that the current risk free rate is 1%, Market Factor is 5.5%, SMB is -2.53%, HML is -0.67%, and UMD is 3%. What is the expected return for this stock? CAPM SUMMARY OUTPUT Regression Statistics Multiple R 0.759829 R Square 0.577339 Adjusted R Square 0.57718 Standard Error 0.012995 Observations 2644 ANOVA df SSMSF gnificance F Regression 1 0.609402 0.609402 3608.88 0 Residual 2642 0.446133 0.000169 Total 2643 1.055535 Coefficientsandard Errt Stat P-value Lower 95%Upper 95%ower 95.09 pper 95.09 Intercept 0.000259 0.000253 1.023776 0.306035 -0.00024 0.000754 -0.00024 0.000754 XSMarketRet 1.112482 0.018519 60.07395 0 1.07617 1.148795 1.07617 1.148795 FAMA-FRENCH SUMMARY OUTPUT Regression Statistics Multiple R 0.76433 R Square 0.5842 Adjusted R Square 0.583727 Standard Error 0.012894 Observations 2644 ANOVA df SSMSF gnificance F Regression 3 0.616644 0.205548 1236.402 Residual 2640 0.438892 0.000166 2643 1.055535 Coefficientsandard Errt Stat P-value Lower 95%Upper 95%ower 95.09 pper 95.0% Intercept 0.000306 0.000251 1.217883 0.223377 -0.00019 0.000797 -0.00019 0.000797 XSMarket Ret 1.141365 0.019311 59.10299 01.103498 1.179232 1.103498 1.179232 SMB -0.25489 0.042692 -5.97028 2.69E-09 -0.3386 -0.17117 -0.3386 -0.17117 HML -0.14008 0.044994 -3.11318 0.001871 -0.2283 -0.05185 -0.2283 -0.05185 Total CARHART SUMMARY OUTPUT Regression Statistics Multiple R 0.76564 R Square 0.586204 Adjusted R Square 0.585577 Standard Error 0.012865 Observations 2644 ANOVA df SSM S F gnificance F Regression 4 0.61876 0.15469 934.6365 Residual 2639 0.436776 0.000166 Total 2643 1.055535 Coefficientsandard Errt Stat P-value Lower 95%Upper 95%ower 95.09 pper 95.09 Intercept 0.00032 0.00025 1.27842 0.201214 -0.00017 0.000811 -0.00017 0.000811 XSMarketRet 1.112828 0.020856 53.3573 01.071932 1.153724 1.071932 1.153724 SMB -0.23439 0.042981 -5.45321 5.41E-08 -0.31867 -0.15011 -0.31867 -0.15011 HML -0.19038 0.047047 -4.04659 5.35E-05 -0.28263 -0.09813 -0.28263 -0.09813 UMD -0.10053 0.028118 -3.57549 0.000356 -0.15567 -0.0454 -0.15567 -0.0454 Your analysis of Disney (DIS) returns using different asset pricing models has led to the regression outputs on the next two pages (pages 4 and 5) for the CAPM, Fama-French 3- factor, and Carhart 4-factor models. By referring to the regression outputs on those pages answer the following questions: c. For Fama-French what are the explanatory variables? Which ones are significant? d. Use the Carhart model to answer the following question: Suppose that the current risk free rate is 1%, Market Factor is 5.5%, SMB is -2.53%, HML is -0.67%, and UMD is 3%. What is the expected return for this stock? CAPM SUMMARY OUTPUT Regression Statistics Multiple R 0.759829 R Square 0.577339 Adjusted R Square 0.57718 Standard Error 0.012995 Observations 2644 ANOVA df SSMSF gnificance F Regression 1 0.609402 0.609402 3608.88 0 Residual 2642 0.446133 0.000169 Total 2643 1.055535 Coefficientsandard Errt Stat P-value Lower 95%Upper 95%ower 95.09 pper 95.09 Intercept 0.000259 0.000253 1.023776 0.306035 -0.00024 0.000754 -0.00024 0.000754 XSMarketRet 1.112482 0.018519 60.07395 0 1.07617 1.148795 1.07617 1.148795 FAMA-FRENCH SUMMARY OUTPUT Regression Statistics Multiple R 0.76433 R Square 0.5842 Adjusted R Square 0.583727 Standard Error 0.012894 Observations 2644 ANOVA df SSMSF gnificance F Regression 3 0.616644 0.205548 1236.402 Residual 2640 0.438892 0.000166 2643 1.055535 Coefficientsandard Errt Stat P-value Lower 95%Upper 95%ower 95.09 pper 95.0% Intercept 0.000306 0.000251 1.217883 0.223377 -0.00019 0.000797 -0.00019 0.000797 XSMarket Ret 1.141365 0.019311 59.10299 01.103498 1.179232 1.103498 1.179232 SMB -0.25489 0.042692 -5.97028 2.69E-09 -0.3386 -0.17117 -0.3386 -0.17117 HML -0.14008 0.044994 -3.11318 0.001871 -0.2283 -0.05185 -0.2283 -0.05185 Total CARHART SUMMARY OUTPUT Regression Statistics Multiple R 0.76564 R Square 0.586204 Adjusted R Square 0.585577 Standard Error 0.012865 Observations 2644 ANOVA df SSM S F gnificance F Regression 4 0.61876 0.15469 934.6365 Residual 2639 0.436776 0.000166 Total 2643 1.055535 Coefficientsandard Errt Stat P-value Lower 95%Upper 95%ower 95.09 pper 95.09 Intercept 0.00032 0.00025 1.27842 0.201214 -0.00017 0.000811 -0.00017 0.000811 XSMarketRet 1.112828 0.020856 53.3573 01.071932 1.153724 1.071932 1.153724 SMB -0.23439 0.042981 -5.45321 5.41E-08 -0.31867 -0.15011 -0.31867 -0.15011 HML -0.19038 0.047047 -4.04659 5.35E-05 -0.28263 -0.09813 -0.28263 -0.09813 UMD -0.10053 0.028118 -3.57549 0.000356 -0.15567 -0.0454 -0.15567 -0.0454
