

Question
Your analysis of Disney (DIS) returns using different asset pricing models has led to the regression outputs on the next two pages (pages 4 and
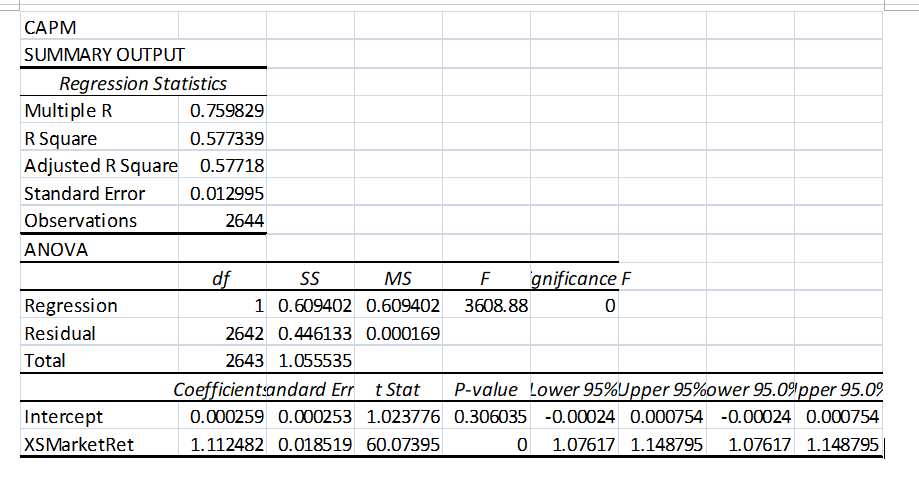
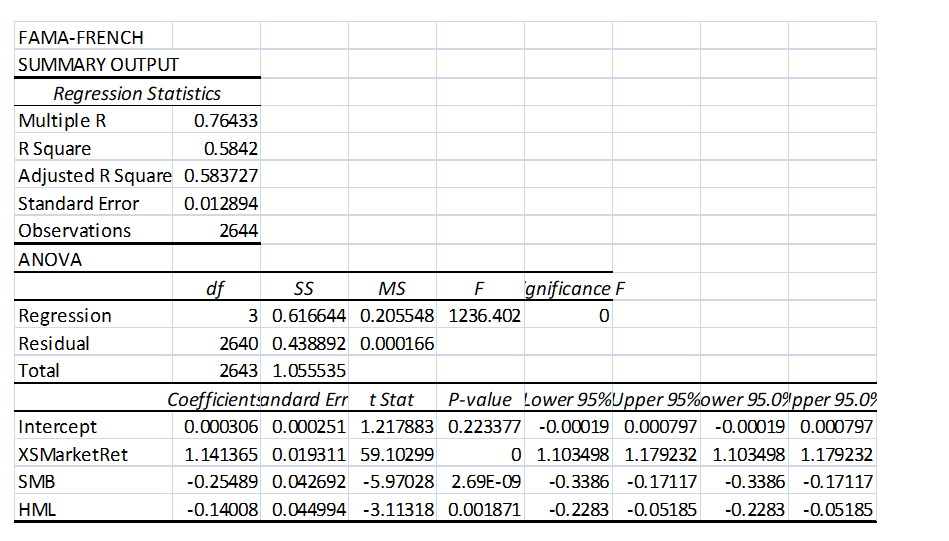
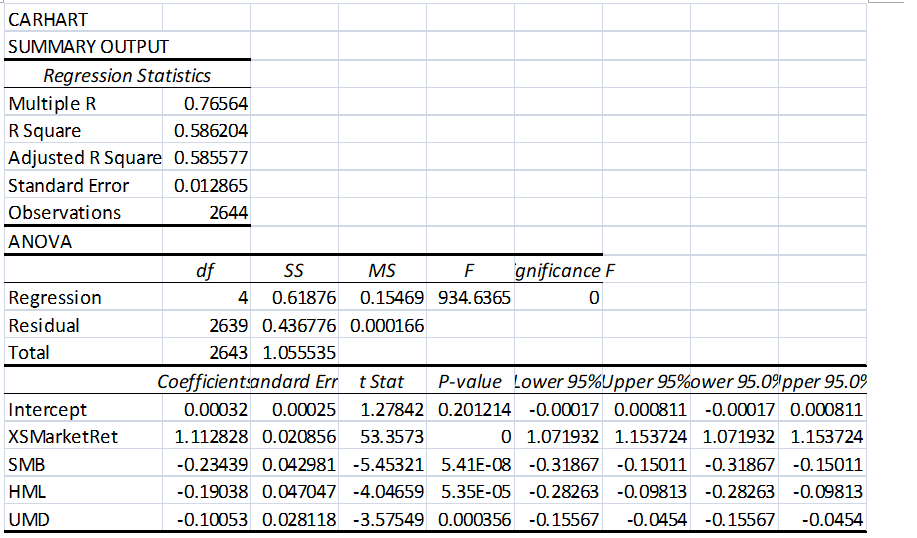
Your analysis of Disney (DIS) returns using different asset pricing models has led to the regression outputs on the next two pages (pages 4 and 5) for the CAPM, Fama-French 3-factor, and Carhart 4-factor models. By referring to the regression outputs on those pages answer the following questions:
a. Which one of the three models is superior? Why?
b. For CAPM, what is the explanatory variable? Is it statistically significant?
c. For Fama-French what are the explanatory variables? Which ones are significant?
d. Use the Carhart model to answer the following question: Suppose that the current risk free rate is 1%, Market Factor is 5.5%, SMB is -2.53%, HML is -0.67%, and UMD is 3%. What is the expected return for this stock?
Step by Step Solution
There are 3 Steps involved in it
Step: 1

Get Instant Access to Expert-Tailored Solutions
See step-by-step solutions with expert insights and AI powered tools for academic success
Step: 2

Step: 3
Ace Your Homework with AI
Get the answers you need in no time with our AI-driven, step-by-step assistance
Get Started
Contemporary Issues In Development Finance
Authors: Joshua Yindenaba Abor, Robert Lensink, Charles Komla Delali Adjasi
1st Edition
1138324329, 978-1138324329