Your Assignment (!) consists of two parts: one, regression analysis, and two, univariate analysis (Forecasting). I will provide the regression data (Table 1) for you
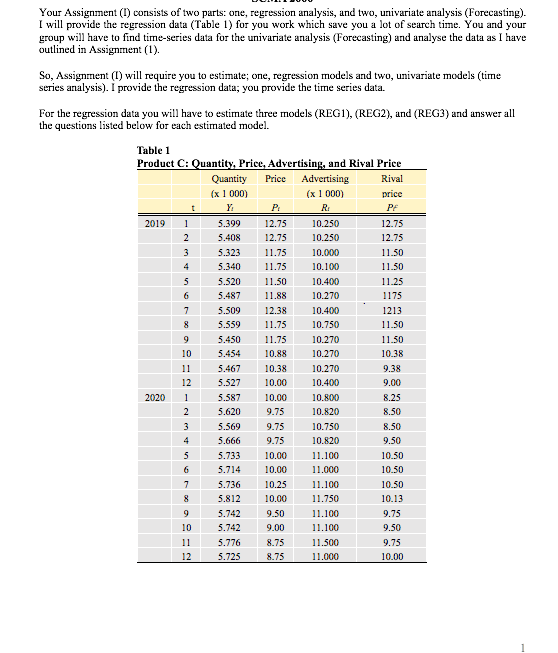
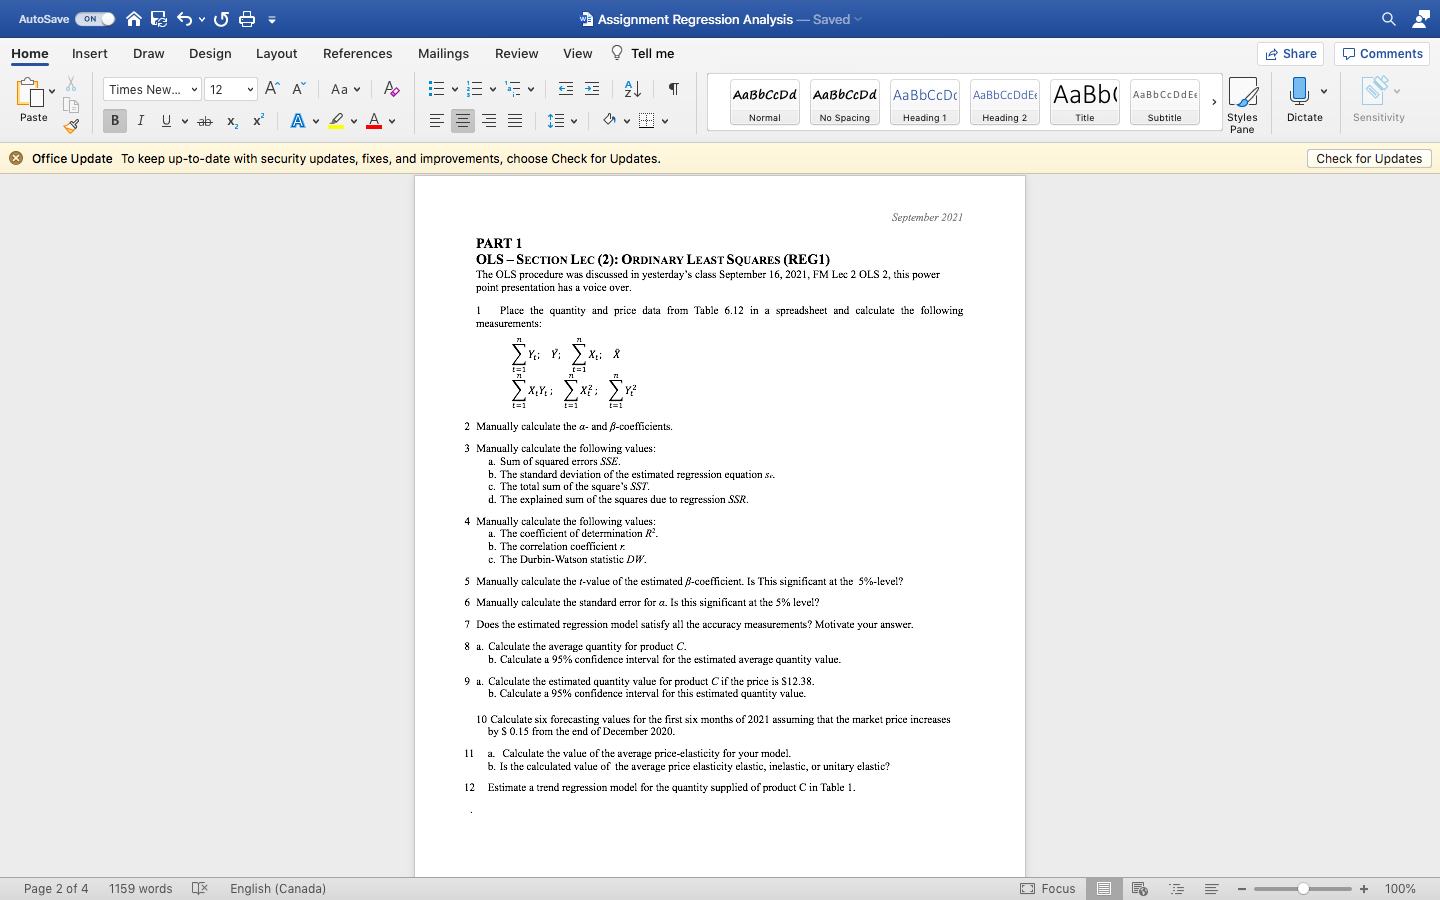
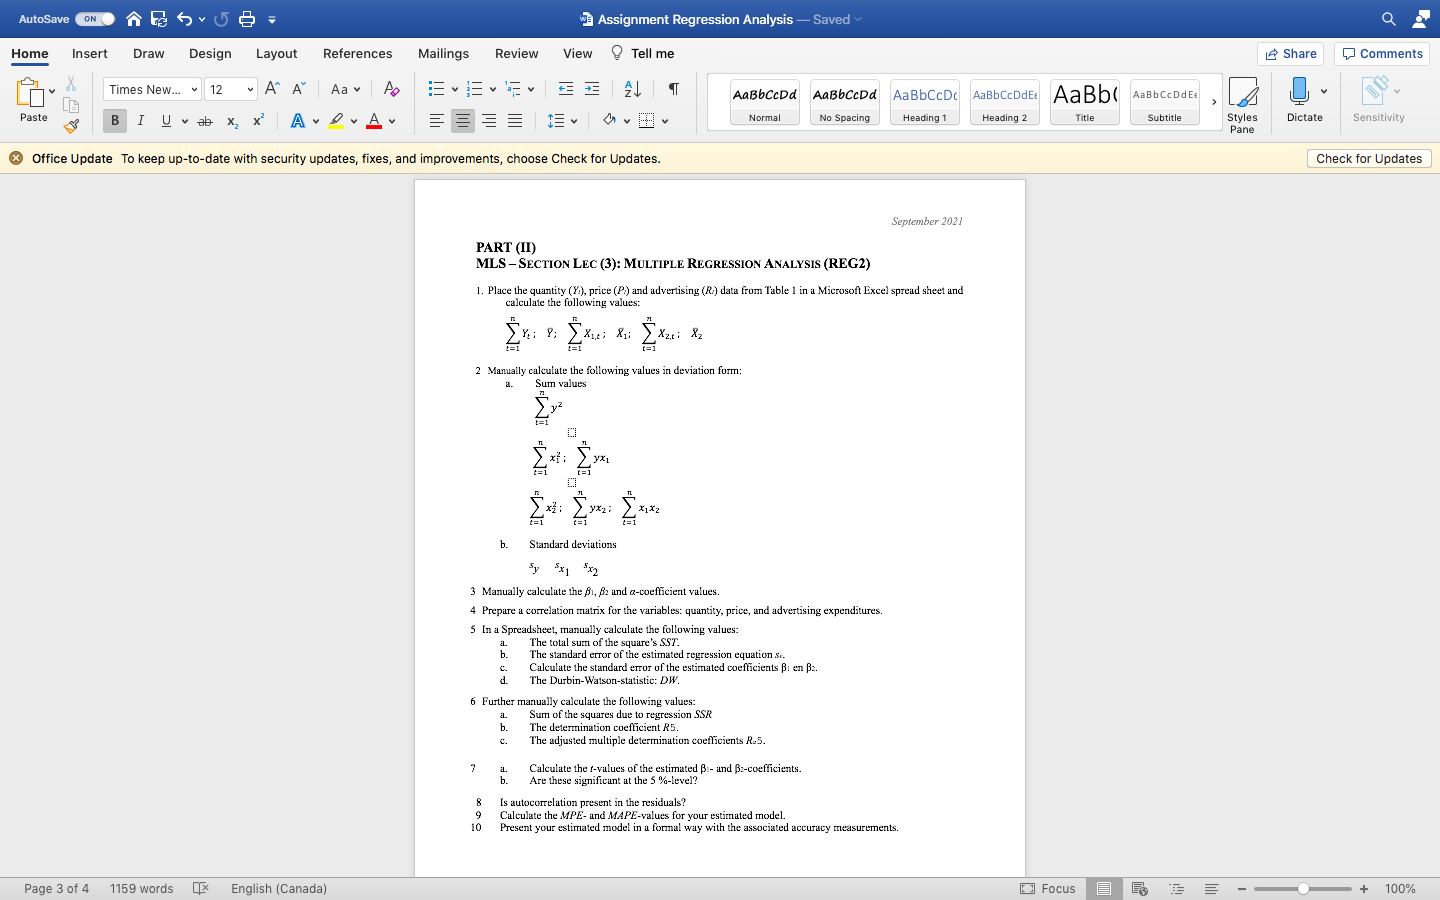
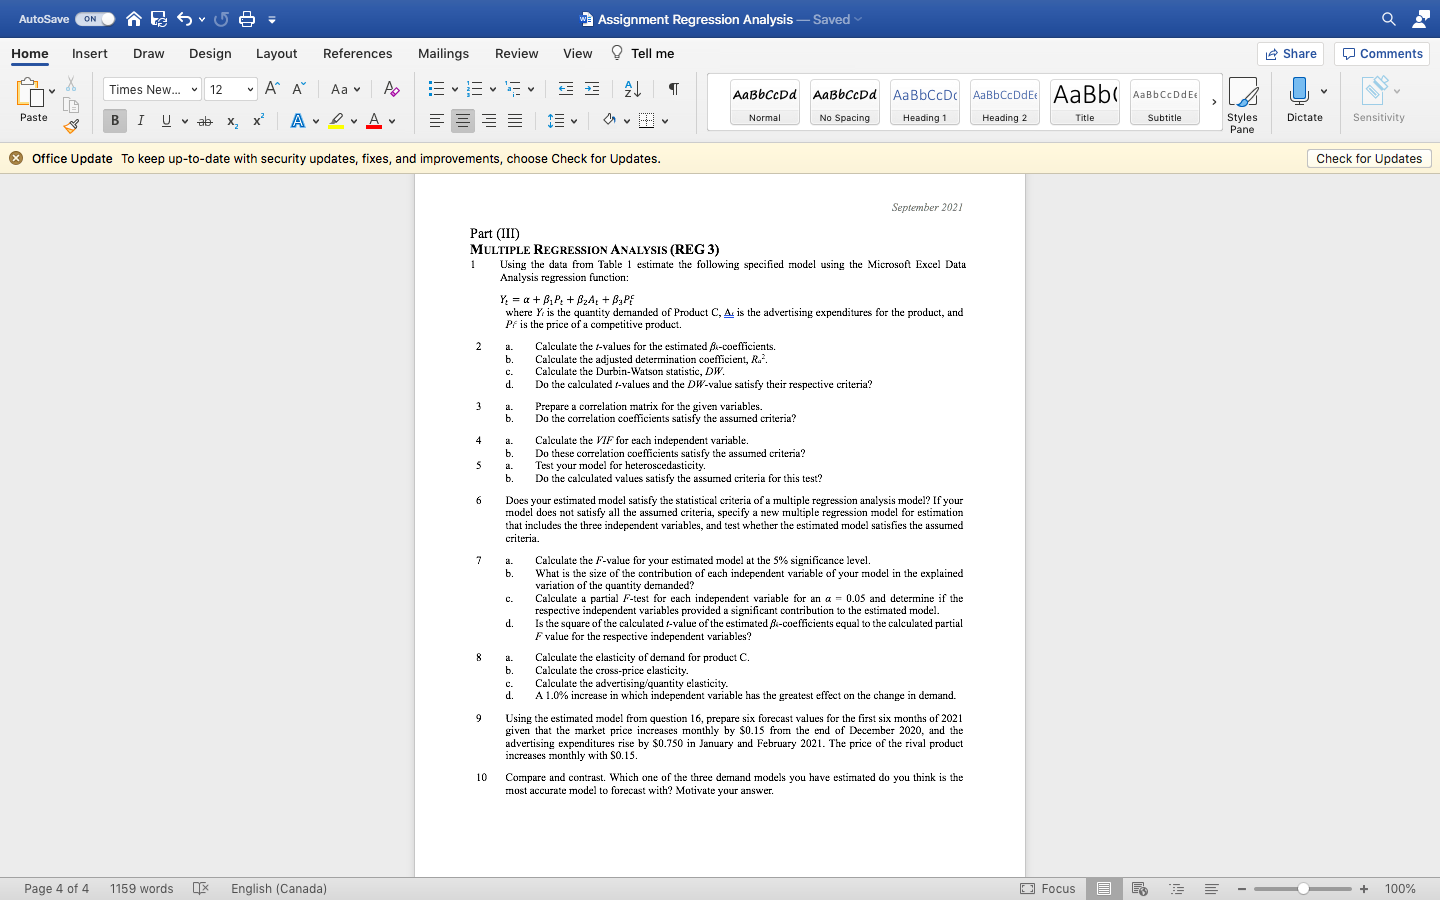
Your Assignment (!) consists of two parts: one, regression analysis, and two, univariate analysis (Forecasting). I will provide the regression data (Table 1) for you work which save you a lot of search time. You and your group will have to find time-series data for the univariate analysis (Forecasting) and analyse the data as I have outlined in Assignment (1). So, Assignment (I) will require you to estimate; one, regression models and two, univariate models (time series analysis). I provide the regression data; you provide the time series data. For the regression data you will have to estimate three models (REGI), (REG2), and (REG3) and answer all the questions listed below for each estimated model. Table 1 Product C: Quantity, Price, Advertising, and Rival Price Quantity Price Advertising Rival (x 1 000) (x 1 000) price 2019 5.399 12.75 10.250 12.75 5.408 12.75 10.250 12.75 5.323 11.75 10.000 11.50 5.340 11.75 10.100 11.50 5.520 11.50 10.400 11.25 5.487 11.88 10.270 1175 5.509 12.38 10.400 1213 5.559 11.75 10.750 11.50 5.450 11.75 10.270 11.50 10 5.454 10.88 10.270 10.38 5.467 10.38 10.270 9.38 12 5.527 10.00 10.400 9.00 2020 5.587 10.00 10.800 8.25 5.620 9.75 10.820 8.50 5.569 9.75 10.750 8.50 5.666 9.75 10.820 9.50 5.733 10.00 11.100 10.50 5.714 10.00 11.000 10.50 5.736 10.25 11.100 10.50 5.812 10.00 11.750 10.13 5.742 9.50 11.100 2.75 10 5.742 9_00 11.100 9.50 11 5.776 8.75 11.500 2.75 12 5.725 8.75 11.000 10.00AutoSave ON. 7 63 6 . 6 6 : 1Assignment Regression Analysis - Saved Q Home Insert Draw Design Layout References Mailings Review View ? Tell me Share Comments Times New... ~ 12 A" A Aa Ap EEVEEVEE AaBbCcDd AaBbCcDd AaBbCcDc AaBbCcDdE AaBb( AaBbCcDdE Paste BI Uvab X x A LA Normal No Spacing Heading 1 Heading 2 Title Subtitle Styles Dictate Sensitivity Pane * Office Update To keep up-to-date with security updates, fixes, and improvements, choose Check for Updates. Check for Updates September 2021 PART 1 OLS -SECTION LEC (2): ORDINARY LEAST SQUARES (REGI) The OLS procedure was discussed in yesterday's class September 16, 2021, FM Lec 2 OLS 2, this power point presentation has a voice over. 1 Place the quantity and price data from Table 6.12 in a spreadsheet and calculate the following measurements : Xti SX Li 2 Manually calculate the a- and f-coefficients. 3 Manually calculate the following values: a. Sum of squared errors SSE. . The standard deviation of the estimated regression equation se. c. The total sum of the square's SST. I. The explained sum of the squares due to regression SSR. 4 Manually calculate the following values: a. The coefficient of determination R'. . The correlation coefficient r c. The Durbin-Watson statistic DW. 5 Manually calculate the f-value of the estimated f-coefficient. Is This significant at the 5%-level? 6 Manually calculate the standard error for a. Is this significant at the 5% level! 7 Does the estimated regression model satisfy all the accuracy measurements? Motivate your answer. 8 a. Calculate the average quantity for product C. b. Calculate a 95% confidence interval for the estimated average quantity value. 9 a. Calculate the estimated quantity value for product C if the price is $12.38. b. Calculate a 95% confidence interval for this estimated quantity value. 10 Calculate six forecasting values for the first six months of 2021 assuming that the market price increases by $ 0.15 from the end of December 2020. 11 a. Calculate the value of the average price-elasticity for your model. b. Is the calculated value of the average price elasticity elastic, inelastic, or unitary elastic? 12 Estimate a trend regression model for the quantity supplied of product C in Table 1. Page 2 of 4 1159 words & English (Canada) Focus E + 100%AutoSave ON 7 3 6 . 6 6 : 1Assignment Regression Analysis - Saved Q Home Insert Draw Design Layout References Mailings Review View ? Tell me Share Comments Times New... ~ 12 A" A Aa Ap AaBbCCDd AaBbCcDd AaBbCcDc AaBbCcDdE AaBb( AaBbCcDdE Paste BI Uvab X x A LA Normal No Spacing Heading 1 Heading 2 Title Subtitle Styles Dictate Sensitivity Pane * Office Update To keep up-to-date with security updates, fixes, and improvements, choose Check for Updates. Check for Updates September 2021 PART (II) MLS - SECTION LEC (3): MULTIPLE REGRESSION ANALYSIS (REG2) 1. Place the quantity (71), price (P) and advertising (R.) data from Table 1 in a Microsoft Excel spread sheet and calculate the following values: 2 Manually calculate the following values in deviation form: a. Sum values yx1 Sxi: yxzi b. Standard deviations y $x1 x2 3 Manually calculate the fi, 82 and a-coefficient values 4 Prepare a correlation matrix for the variables: quantity, price, and advertising expenditures. 5 In a Spreadsheet, manually calculate the following values: a. The total sum of the square's SST. The standard error of the estimated regression equation s. Calculate the standard error of the estimated coefficients Bi en Bz. d. The Durbin-Watson-statistic: DW 6 Further manually calculate the following values: Sum of the squares due to regression SSR The determination coefficient R5 The adjusted multiple determination coefficients R.5. 7 a. Calculate the f-values of the estimated Bi- and B:-coefficients. Are these significant at the 5 %-level? Is autocorrelation present in the residuals? 9 Calculate the MPE- and MAPE-values for your estimated model. Present your estimated model in a formal way with the associated accuracy measurements. Page 3 of 4 1159 words x English (Canada Focus E + 100%AutoSave ON 7 3 6 . 6 6 : 1Assignment Regression Analysis - Saved Q Home Insert Draw Design Layout References Mailings Review View ? Tell me Share Comments Times New... ~ 12 A" A Aa Ap AaBbCcDd AaBbCcDd AaBbCcDc AaBbCcDdE AaBb( AaBbCcDdE Paste BI Uvab X x A LA . Normal No Spacing Heading 1 Heading 2 Title Subtitle Styles Dictate Sensitivity Pane Office Update To keep up-to-date with security updates, fixes, and improvements, choose Check for Updates. Check for Updates September 2021 Part (III) MULTIPLE REGRESSION ANALYSIS (REG 3) Using the data from Table 1 estimate the following specified model using the Microsoft Excel Data Analysis regression function: Y=a+BP +P2A + Bape where It is the quantity demanded of Product C, A is the advertising expenditures for the product, and Pf is the price of a competitive product. a. Calculate the t-values for the estimated A-coefficients. Calculate the adjusted determination coefficient, R. . Calculate the Durbin-Watson statistic, DW. Do the calculated f-values and the DW/-value satisfy their respective criteria? Prepare a correlation matrix for the given variables. Do the correlation coefficients satisfy the assumed criteria? Calculate the WIF for each independent variable. Do these correlation coefficients satisfy the assumed criteria? Test your model for heteroscedasticity. Do the calculated values satisfy the assumed criteria for this test? 6 Does your estimated model satisfy the statistical criteria of a multiple regression analysis model? If your model does not satisfy all the assumed criteria, specify a new multiple regression model for estimation that includes the three independent variables, and test whether the estimated model satisfies the assumed criteria. 7 Calculate the F-value for your estimated model at the 5% significance level. What is the size of the contribution of each independent variable of your model in the explained variation of the quantity demanded? C. Calculate a partial F-test for each independent variable for an a = 0.05 and determine if the respective independent variables provided a significant contribution to the estimated model. d. Is the square of the calculated -value of the estimated fi-coefficients equal to the calculated partial " value for the respective independent variables? Calculate the elasticity of demand for product C. Calculate the cross-price elasticity. Calculate the advertising quantity elasticity. A 1.0% increase in which independent variable has the greatest effect on the change in demand. Using the estimated model from question 16, prepare six forecast values for the first six months of 2021 given that the market price increases monthly by $0.15 from the end of December 2020, and the advertising expenditures rise by $0.750 in January and February 2021. The price of the rival product increases monthly with 50.15. 10 Compare and contrast. Which one of the three demand models you have estimated do you think is the most accurate model to forecast with? Motivate your answer. Page 4 of 4 1159 words x English (Canada) Focus E + 100%
Step by Step Solution
There are 3 Steps involved in it
Step: 1
Get Instant Access to Expert-Tailored Solutions
See step-by-step solutions with expert insights and AI powered tools for academic success
Step: 2
Step: 3
Ace Your Homework with AI
Get the answers you need in no time with our AI-driven, step-by-step assistance