

Question
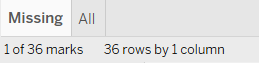
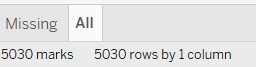
Your audit team is performing audit procedures related to a clients revenue for the month of April 2019. The visualization titled Gap Detection All Invoices
Your audit team is performing audit procedures related to a clients revenue for the month of April 2019. The visualization titled Gap Detection All Invoices presents the clients master sequence of invoices with null indicating a missing invoice. The visualization titled Gap Detection Missing Invoices presents the same data, but only the invoices that are missing (null). Beginning invoice number on April 1st, 2019 is #2816, and ending invoice number, April 26th, 2019 is #7845. You can open the Tableau file in this problem statement with Tableau Desktop software. If you do not have a version of Tableau Desktop, you can open the file with Tableau Reader. Tableau Reader is a free download that allows you to open visualizations built with Tableau Desktop. To find a free download of Tableau Reader on the Tableau website, search for Tableau Reader in your internet browser, or
Question: 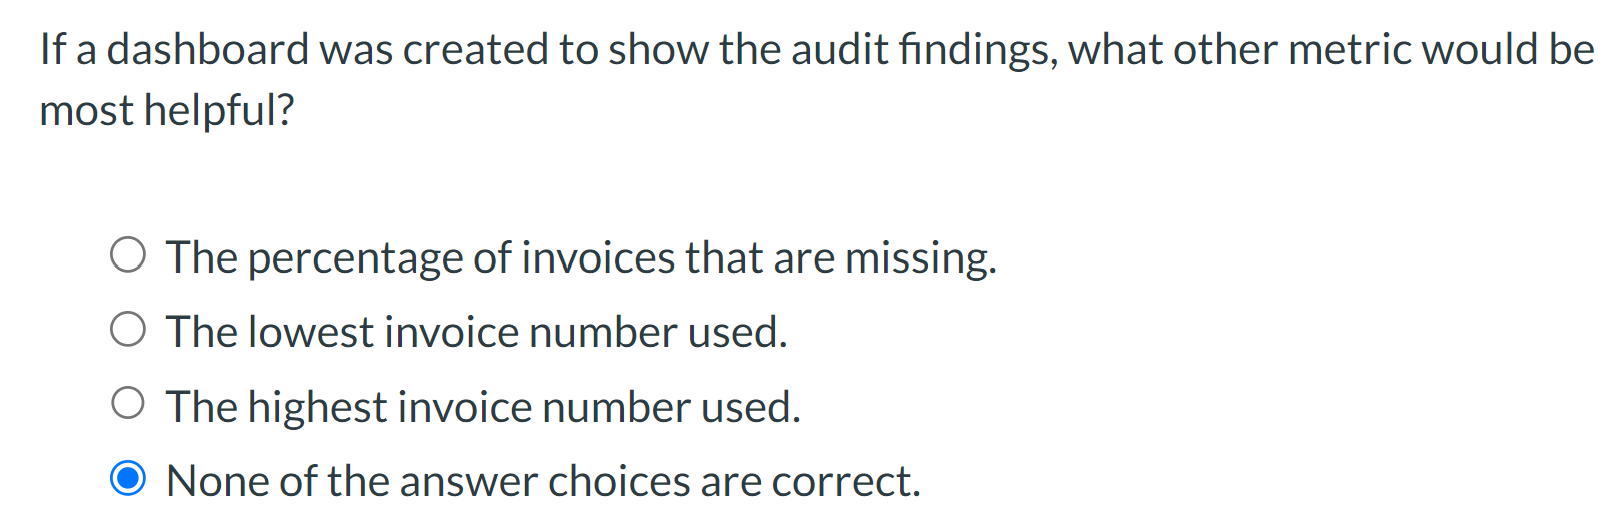
Step by Step Solution
There are 3 Steps involved in it
Step: 1

Get Instant Access to Expert-Tailored Solutions
See step-by-step solutions with expert insights and AI powered tools for academic success
Step: 2

Step: 3
Ace Your Homework with AI
Get the answers you need in no time with our AI-driven, step-by-step assistance
Get Started
Knowledge Audit A Complete Guide
Authors: Gerardus Blokdyk
2020 Edition
0655912835, 978-0655912835