Your Competitive Intelligence team reports that a wave of product liability lawsuits is likely to cause Chester to pull the product City entirely off the market this year. Assume Chester scraps all capacity and inventory this round, completely writing off those assets and escrowing the proceeds to a settlement fund, and assume these lawsuits will have no effect on any other products of Chester or other companies. Without Chester's product City how much can the industry currently produce in the Core segment? Consider only products primarily in the Core segment last year. Ignore current inventories. Figures in thousands (000). 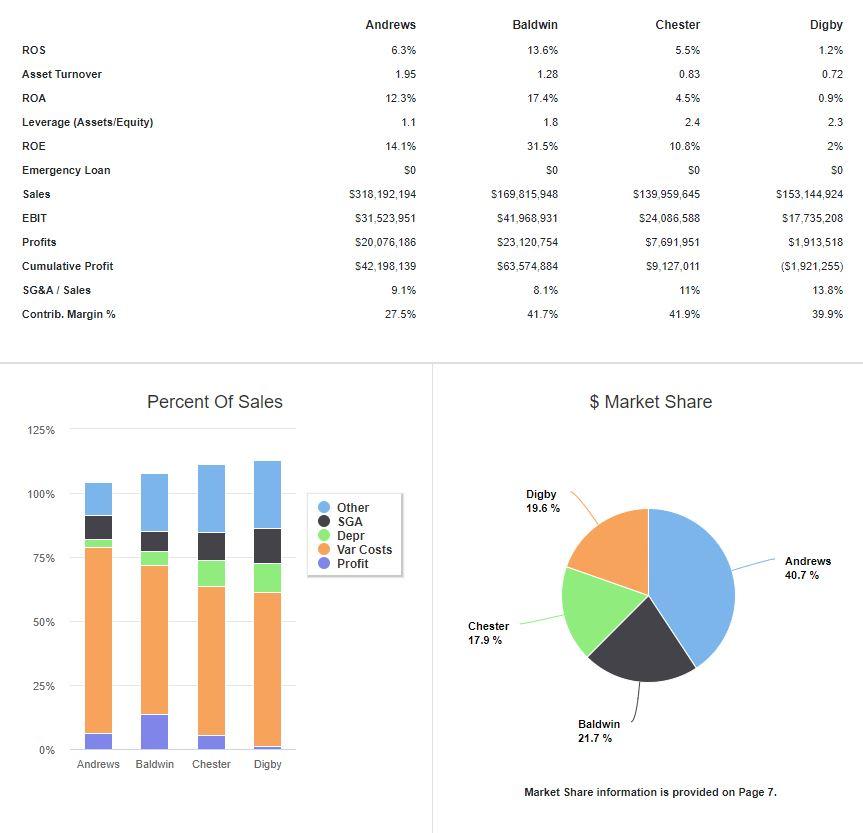
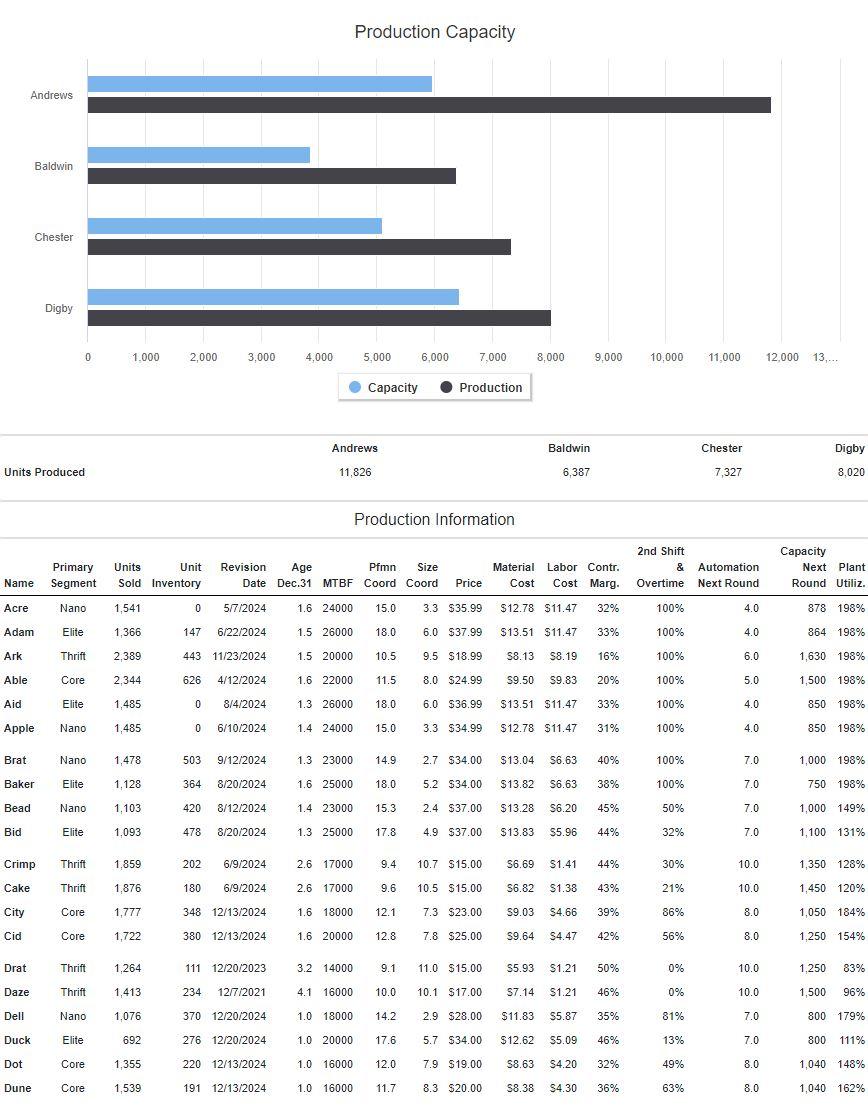
Andrews Baldwin Chester Digby ROS 6.3% 13.6% 5.5% 1.2% Asset Turnover 1.95 1.28 0.83 0.72 ROA 12.3% 17.4% 4.5% 0.9% Leverage (Assets/Equity) 1.1 1.8 2.4 2.3 ROE 14.1% 31.5% 10.8% 2% SO SO SO SO Emergency Loan Sales $139,959,645 $153, 144,924 $17,735,208 EBIT 5318,192,194 $31,523,951 20,076,186 S42, 198, 139 $169,815,948 S41,968,931 S23,120,754 $24,086,588 $7,691,951 $1,913,518 (51,921,255) S63,574.884 S9.127,011 Profits Cumulative Profit SG&A / Sales Contrib. Margin% 9.1% 8.1% 11% 13.8% 27.5% 41.7% 41.9% 39.9% Percent of Sales $ Market Share 125% 100% Digby 19.6 % Other SGA Depr Var Costs Profit 75% Andrews 40.7 % 50% Chester 17.9 % 25% Baldwin 21.7 % 0% Andrews Baldwin Chester Digby Market Share information is provided on Page 7 Stock Market Summary Company Close Change Shares MarketCap(SM) Book Value Per Share EPS Dividend Yield P/E Andrews $89.16 $22.45 2.458,209 S219 $57.92 58.17 $0.00 0.0% 10.9 Baldwin $111.90 $25.82 1,848,292 S207 $39.77 $12.51 $13.85 12.4% 8.9 Chester $33.79 $11.32 3,068,082 S104 $23.23 $2.51 S2.64 7.8% 13.5 Digby $26.55 S464 3.522 425 $94 $26.78 S0.54 S0.00 0.0% 48.8 Closing Stock Price $120 Andrews + Baldwin Chester Digby $100 S80 S60 $40 S20 SO 2016 2017 2018 2019 2020 2021 2022 2023 2024 Bond Market Summary Company Series# Face Yield Closes S&P Andrews 11.9S2028 $60,300 11.4% 104.71 AAA Baldwin 11.252030 $2,857,193 11.9% 93.95 BB 12.0S2031 $1,307,561 12.4% 96.88 BB 12.352032 $15,388,935 12.5% 98.06 BB 12.752033 $5,679,022 12.7% 100.00 BB Chester 12.552028 $12,608,713 13.1% 95.35 12.592029 $7.981,720 13.2% 94.52 CC 12.552030 $9,473,587 13.3% 93.80 8 8 8 8 8 CC 13.452031 S14,407,694 13.8% 97.01 14.052032 $22,742,875 14.1% 99.54 Digby 11.9S2030 $12,665,490 12.9% 92.20 CC 13.052031 $17.783,553 13.5% 96.13 CC 13 752032 $34,772,020 13.8% 99.07 CC 13.982033 $18,743,013 13.9% 100.00 CC Cash Flow Statement Survey Andrews Baldwin Chester Digby $20,076 S23,121 $7,692 $1,914 $10,908 5451 $9,031 ($263) $14.413 (S796) $17,169 ($1.452) 56,932 (S22.826) ) (55.156) S10,385 S3,652 (531,057) ($774) S3,710 ($537) ($1.296) (S753) $18.723 S822 (511,301) ($334) S6,819 Cash flows from operating activities Net Income (Loss) Adjustment for non-cash items: Depreciation Extraordinary gains/losses/writeoffs Changes in current assets and liabilities: Accounts payable Inventory Accounts receivable Net cash from operations Cash flows from investing activities Plant improvements (net) Cash flows from financing activities Dividends paid Sales of common stock Purchase of common stock Cash from long term debt issued Early retirement of long term debt Retirement of current debt Cash from current debt borrowing Cash from emergency loan Net cash from financing activities Net change in cash position ($14.800) SO SO $0 (58,108) SO $0 $10,000 SO $0 ($16.300) SO SO SO SO (S25,597) SO (S2.077) ( SO ($5,060) ($17,687) $23,685 SO SO S6,069 SO SO ($15.951) (S23,483) S27,466 $0 (58.970) (S26.855) S24,331 SO SO (56.300) ($10.715) (526.736) (S23.026) (519.602) (8879) ($5.899) S919 Balance Sheet Survey Baldwin S15,358 $13,957 S34,842 S64,157 Cash Accounts Receivable Inventory Total Current Assets Plant and equipment Accumulated Depreciation Total Fixed Assets Total Assets Accounts Payable Current Debt Total Current Liabilities Long Term Debt Total Liabilities Common Stock Retained Earnings Total Equity Total Liabilities & Owner's Equity Andrews $31,370 S26,153 S22,826 S80,349 $ 163,624 (580.936) $82,688 $ 163,038 S20,605 $0 S20,605 Chester $34.087 $11,504 $13.283 $58,874 $216,200 ($105,596) $110,604 $169,479 $6.656 $135,460 ($66.852) S68,608 $132.765 $10,348 S23,685 S34,033 $25,233 Digby S29,050 S12,587 S19,437 $61,074 $257,540 (5104.538) $153,002 $214.075 S8,299 $27.466 S35,765 583,964 $119,729 S57,464 S36,882 S94,346 $214,075 S24,331 S30.987 S67.215 S98,201 $59,266 S60 520,665 S41,080 S101,292 $142.373 $ 163,038 $9.301 S64,199 S73,500 $132,765 $40.263 S31.014 $71,277 S169.479 Income Statement Survey Sales Variable Costs (Labor, Material, Carry) Contribution Margin Depreciation SGA (R&D Promo, Sales, Admin) Other (Fees. Writeoffs, TQM, Bonuses EBIT Interest (Short term, Long term) Taxes Profit Sharing Net Profit Andrews $318,192 $230.603 S87,589 $10.908 $28,961 S16,196 S31,524 $7 $11,031 S410 $20.076 Baldwin $169,816 599,029 S70,787 $9,031 S13,693 $6,094 S41,969 $5,673 $12,704 $472 $23,121 Chester $139,960 $81.276 $58,684 $14.413 $15.345 $4,839 S24,087 $12.011 S4226 S157 S7,692 Digby $153,145 S91.997 $61,148 $17,169 S21,153 S5,090 $17,735 $14,731 $1,051 $39 S1.914 Production Capacity Andrews Baldwin Chester Digby 0 1.000 2,000 3,000 4,000 5.000 6,000 7.000 8,000 9,000 10,000 11.000 12.000 13... Capacity Production Andrews Baldwin Chester Digby Units Produced 11,826 6,387 7,327 8.020 Production Information Primary Segment Units Unit Sold Inventory Revision Age Pfmn Size Date Dec.31 MTBF Coord Coord Material Labor Contr. Cost Cost Marg. 2nd Shift & Automation Overtime Next Round Capacity Next Plant Round Utiliz. Name Price Acre Nano 1,541 0 5/7/2024 1.6 24000 15.0 3.3 $35.99 $12.78 $11.47 32% 100% 4.0 878 198% Adam Elite 1,366 147 6/22/2024 1.5 26000 18.0 6.0 $37.99 $13.51 $11.47 33% 100% 4.0 864 198% Ark Thrift 2.389 443 11/23/2024 1.5 20000 10.5 9.5 $18.99 S8.13 $8.19 16% 100% 6.0 1,630 198% Able Core 2.344 626 4/12/2024 1.6 22000 11.5 8.0 $24.99 $9.50 $9.83 20% 100% 5.0 1,500 198% Aid Elite 1,485 0 8/4/2024 1.3 26000 18.0 6.0 $36.99 $13.51 $11.47 33% 100% 4.0 850 198% Apple Nano 1,485 0 6/10/2024 1.4 24000 15.0 3.3 $34.99 $12.78 $11.47 31% 100% 4.0 850 198% Brat Nano 1,478 503 9/12/2024 1.3 23000 14.9 2.7 $34.00 $13.04 $6.63 40% 100% 7.0 1,000 198% Baker Elite 1,128 364 8/20/2024 1.6 25000 18.0 5.2 $34.00 $13.82 $6.63 38% 100% 7.0 750 198% Bead Nano 1,103 420 8/12/2024 1.4 23000 15.3 2.4 $37.00 $13.28 $6.20 45% 50% 7.0 1,000 149% Bid Elite 1.093 478 8/20/2024 1.3 25000 17.8 4.9 $37.00 $13.83 $5.96 44% 32% 7.0 1,100 131% Crimp Thrift 1,859 202 6/9/2024 2.6 17000 9.4 10.7 $15.00 S6.69 $1.41 44% 30% 10.0 1,350 128% Cake Thrift 1,876 180 6/9/2024 2.6 17000 9.6 10.5 $15.00 S6.82 $1.38 43% 21% 10.0 1,450 120% City Core 1,777 348 12/13/2024 1.6 18000 12.1 7.3 $23.00 S9.03 $4.66 39% 86% 8.0 1,050 184% Cid Core 1,722 380 12/13/2024 1.6 20000 12.8 7.8 $25.00 9.64 $4.47 42% 56% 8.0 1.250 154% Drat Thrift 1.264 111 12/20/2023 3.2 14000 9.1 11.0 $15.00 $5.93 S1.21 50% 0% 10.0 1.250 83% Daze Thrift 1,413 234 12/7/2021 4.1 16000 10.0 10.1 $17.00 $7.14 $1.21 46% 0% 10.0 1,500 96% Dell Nano 1,076 1.0 18000 14.2 2.9 $28.00 $11.83 $5.87 35% 81% 7.0 800 179% 370 12/20/2024 276 12/20/2024 Duck Elite 692 1.0 20000 17.6 5.7 $34.00 $12.62 $5.09 46% 13% 7.0 800 111% Dot Core 1,355 220 12/13/2024 1.0 16000 12.0 7.9 $19.00 58.63 $4.20 32% 49% % 8.0 1,040 148% Dune Core 1.539 191 12/13/2024 1.0 16000 11.7 8.3 $20.00 $8.38 $4.30 36% 63% 8.0 1.040 162% Andrews Baldwin Chester Digby ROS 6.3% 13.6% 5.5% 1.2% Asset Turnover 1.95 1.28 0.83 0.72 ROA 12.3% 17.4% 4.5% 0.9% Leverage (Assets/Equity) 1.1 1.8 2.4 2.3 ROE 14.1% 31.5% 10.8% 2% SO SO SO SO Emergency Loan Sales $139,959,645 $153, 144,924 $17,735,208 EBIT 5318,192,194 $31,523,951 20,076,186 S42, 198, 139 $169,815,948 S41,968,931 S23,120,754 $24,086,588 $7,691,951 $1,913,518 (51,921,255) S63,574.884 S9.127,011 Profits Cumulative Profit SG&A / Sales Contrib. Margin% 9.1% 8.1% 11% 13.8% 27.5% 41.7% 41.9% 39.9% Percent of Sales $ Market Share 125% 100% Digby 19.6 % Other SGA Depr Var Costs Profit 75% Andrews 40.7 % 50% Chester 17.9 % 25% Baldwin 21.7 % 0% Andrews Baldwin Chester Digby Market Share information is provided on Page 7 Stock Market Summary Company Close Change Shares MarketCap(SM) Book Value Per Share EPS Dividend Yield P/E Andrews $89.16 $22.45 2.458,209 S219 $57.92 58.17 $0.00 0.0% 10.9 Baldwin $111.90 $25.82 1,848,292 S207 $39.77 $12.51 $13.85 12.4% 8.9 Chester $33.79 $11.32 3,068,082 S104 $23.23 $2.51 S2.64 7.8% 13.5 Digby $26.55 S464 3.522 425 $94 $26.78 S0.54 S0.00 0.0% 48.8 Closing Stock Price $120 Andrews + Baldwin Chester Digby $100 S80 S60 $40 S20 SO 2016 2017 2018 2019 2020 2021 2022 2023 2024 Bond Market Summary Company Series# Face Yield Closes S&P Andrews 11.9S2028 $60,300 11.4% 104.71 AAA Baldwin 11.252030 $2,857,193 11.9% 93.95 BB 12.0S2031 $1,307,561 12.4% 96.88 BB 12.352032 $15,388,935 12.5% 98.06 BB 12.752033 $5,679,022 12.7% 100.00 BB Chester 12.552028 $12,608,713 13.1% 95.35 12.592029 $7.981,720 13.2% 94.52 CC 12.552030 $9,473,587 13.3% 93.80 8 8 8 8 8 CC 13.452031 S14,407,694 13.8% 97.01 14.052032 $22,742,875 14.1% 99.54 Digby 11.9S2030 $12,665,490 12.9% 92.20 CC 13.052031 $17.783,553 13.5% 96.13 CC 13 752032 $34,772,020 13.8% 99.07 CC 13.982033 $18,743,013 13.9% 100.00 CC Cash Flow Statement Survey Andrews Baldwin Chester Digby $20,076 S23,121 $7,692 $1,914 $10,908 5451 $9,031 ($263) $14.413 (S796) $17,169 ($1.452) 56,932 (S22.826) ) (55.156) S10,385 S3,652 (531,057) ($774) S3,710 ($537) ($1.296) (S753) $18.723 S822 (511,301) ($334) S6,819 Cash flows from operating activities Net Income (Loss) Adjustment for non-cash items: Depreciation Extraordinary gains/losses/writeoffs Changes in current assets and liabilities: Accounts payable Inventory Accounts receivable Net cash from operations Cash flows from investing activities Plant improvements (net) Cash flows from financing activities Dividends paid Sales of common stock Purchase of common stock Cash from long term debt issued Early retirement of long term debt Retirement of current debt Cash from current debt borrowing Cash from emergency loan Net cash from financing activities Net change in cash position ($14.800) SO SO $0 (58,108) SO $0 $10,000 SO $0 ($16.300) SO SO SO SO (S25,597) SO (S2.077) ( SO ($5,060) ($17,687) $23,685 SO SO S6,069 SO SO ($15.951) (S23,483) S27,466 $0 (58.970) (S26.855) S24,331 SO SO (56.300) ($10.715) (526.736) (S23.026) (519.602) (8879) ($5.899) S919 Balance Sheet Survey Baldwin S15,358 $13,957 S34,842 S64,157 Cash Accounts Receivable Inventory Total Current Assets Plant and equipment Accumulated Depreciation Total Fixed Assets Total Assets Accounts Payable Current Debt Total Current Liabilities Long Term Debt Total Liabilities Common Stock Retained Earnings Total Equity Total Liabilities & Owner's Equity Andrews $31,370 S26,153 S22,826 S80,349 $ 163,624 (580.936) $82,688 $ 163,038 S20,605 $0 S20,605 Chester $34.087 $11,504 $13.283 $58,874 $216,200 ($105,596) $110,604 $169,479 $6.656 $135,460 ($66.852) S68,608 $132.765 $10,348 S23,685 S34,033 $25,233 Digby S29,050 S12,587 S19,437 $61,074 $257,540 (5104.538) $153,002 $214.075 S8,299 $27.466 S35,765 583,964 $119,729 S57,464 S36,882 S94,346 $214,075 S24,331 S30.987 S67.215 S98,201 $59,266 S60 520,665 S41,080 S101,292 $142.373 $ 163,038 $9.301 S64,199 S73,500 $132,765 $40.263 S31.014 $71,277 S169.479 Income Statement Survey Sales Variable Costs (Labor, Material, Carry) Contribution Margin Depreciation SGA (R&D Promo, Sales, Admin) Other (Fees. Writeoffs, TQM, Bonuses EBIT Interest (Short term, Long term) Taxes Profit Sharing Net Profit Andrews $318,192 $230.603 S87,589 $10.908 $28,961 S16,196 S31,524 $7 $11,031 S410 $20.076 Baldwin $169,816 599,029 S70,787 $9,031 S13,693 $6,094 S41,969 $5,673 $12,704 $472 $23,121 Chester $139,960 $81.276 $58,684 $14.413 $15.345 $4,839 S24,087 $12.011 S4226 S157 S7,692 Digby $153,145 S91.997 $61,148 $17,169 S21,153 S5,090 $17,735 $14,731 $1,051 $39 S1.914 Production Capacity Andrews Baldwin Chester Digby 0 1.000 2,000 3,000 4,000 5.000 6,000 7.000 8,000 9,000 10,000 11.000 12.000 13... Capacity Production Andrews Baldwin Chester Digby Units Produced 11,826 6,387 7,327 8.020 Production Information Primary Segment Units Unit Sold Inventory Revision Age Pfmn Size Date Dec.31 MTBF Coord Coord Material Labor Contr. Cost Cost Marg. 2nd Shift & Automation Overtime Next Round Capacity Next Plant Round Utiliz. Name Price Acre Nano 1,541 0 5/7/2024 1.6 24000 15.0 3.3 $35.99 $12.78 $11.47 32% 100% 4.0 878 198% Adam Elite 1,366 147 6/22/2024 1.5 26000 18.0 6.0 $37.99 $13.51 $11.47 33% 100% 4.0 864 198% Ark Thrift 2.389 443 11/23/2024 1.5 20000 10.5 9.5 $18.99 S8.13 $8.19 16% 100% 6.0 1,630 198% Able Core 2.344 626 4/12/2024 1.6 22000 11.5 8.0 $24.99 $9.50 $9.83 20% 100% 5.0 1,500 198% Aid Elite 1,485 0 8/4/2024 1.3 26000 18.0 6.0 $36.99 $13.51 $11.47 33% 100% 4.0 850 198% Apple Nano 1,485 0 6/10/2024 1.4 24000 15.0 3.3 $34.99 $12.78 $11.47 31% 100% 4.0 850 198% Brat Nano 1,478 503 9/12/2024 1.3 23000 14.9 2.7 $34.00 $13.04 $6.63 40% 100% 7.0 1,000 198% Baker Elite 1,128 364 8/20/2024 1.6 25000 18.0 5.2 $34.00 $13.82 $6.63 38% 100% 7.0 750 198% Bead Nano 1,103 420 8/12/2024 1.4 23000 15.3 2.4 $37.00 $13.28 $6.20 45% 50% 7.0 1,000 149% Bid Elite 1.093 478 8/20/2024 1.3 25000 17.8 4.9 $37.00 $13.83 $5.96 44% 32% 7.0 1,100 131% Crimp Thrift 1,859 202 6/9/2024 2.6 17000 9.4 10.7 $15.00 S6.69 $1.41 44% 30% 10.0 1,350 128% Cake Thrift 1,876 180 6/9/2024 2.6 17000 9.6 10.5 $15.00 S6.82 $1.38 43% 21% 10.0 1,450 120% City Core 1,777 348 12/13/2024 1.6 18000 12.1 7.3 $23.00 S9.03 $4.66 39% 86% 8.0 1,050 184% Cid Core 1,722 380 12/13/2024 1.6 20000 12.8 7.8 $25.00 9.64 $4.47 42% 56% 8.0 1.250 154% Drat Thrift 1.264 111 12/20/2023 3.2 14000 9.1 11.0 $15.00 $5.93 S1.21 50% 0% 10.0 1.250 83% Daze Thrift 1,413 234 12/7/2021 4.1 16000 10.0 10.1 $17.00 $7.14 $1.21 46% 0% 10.0 1,500 96% Dell Nano 1,076 1.0 18000 14.2 2.9 $28.00 $11.83 $5.87 35% 81% 7.0 800 179% 370 12/20/2024 276 12/20/2024 Duck Elite 692 1.0 20000 17.6 5.7 $34.00 $12.62 $5.09 46% 13% 7.0 800 111% Dot Core 1,355 220 12/13/2024 1.0 16000 12.0 7.9 $19.00 58.63 $4.20 32% 49% % 8.0 1,040 148% Dune Core 1.539 191 12/13/2024 1.0 16000 11.7 8.3 $20.00 $8.38 $4.30 36% 63% 8.0 1.040 162%