Your electronic files, including both excel and word files, must be submitted. Please use a separate worksheet in excel for each question and label them
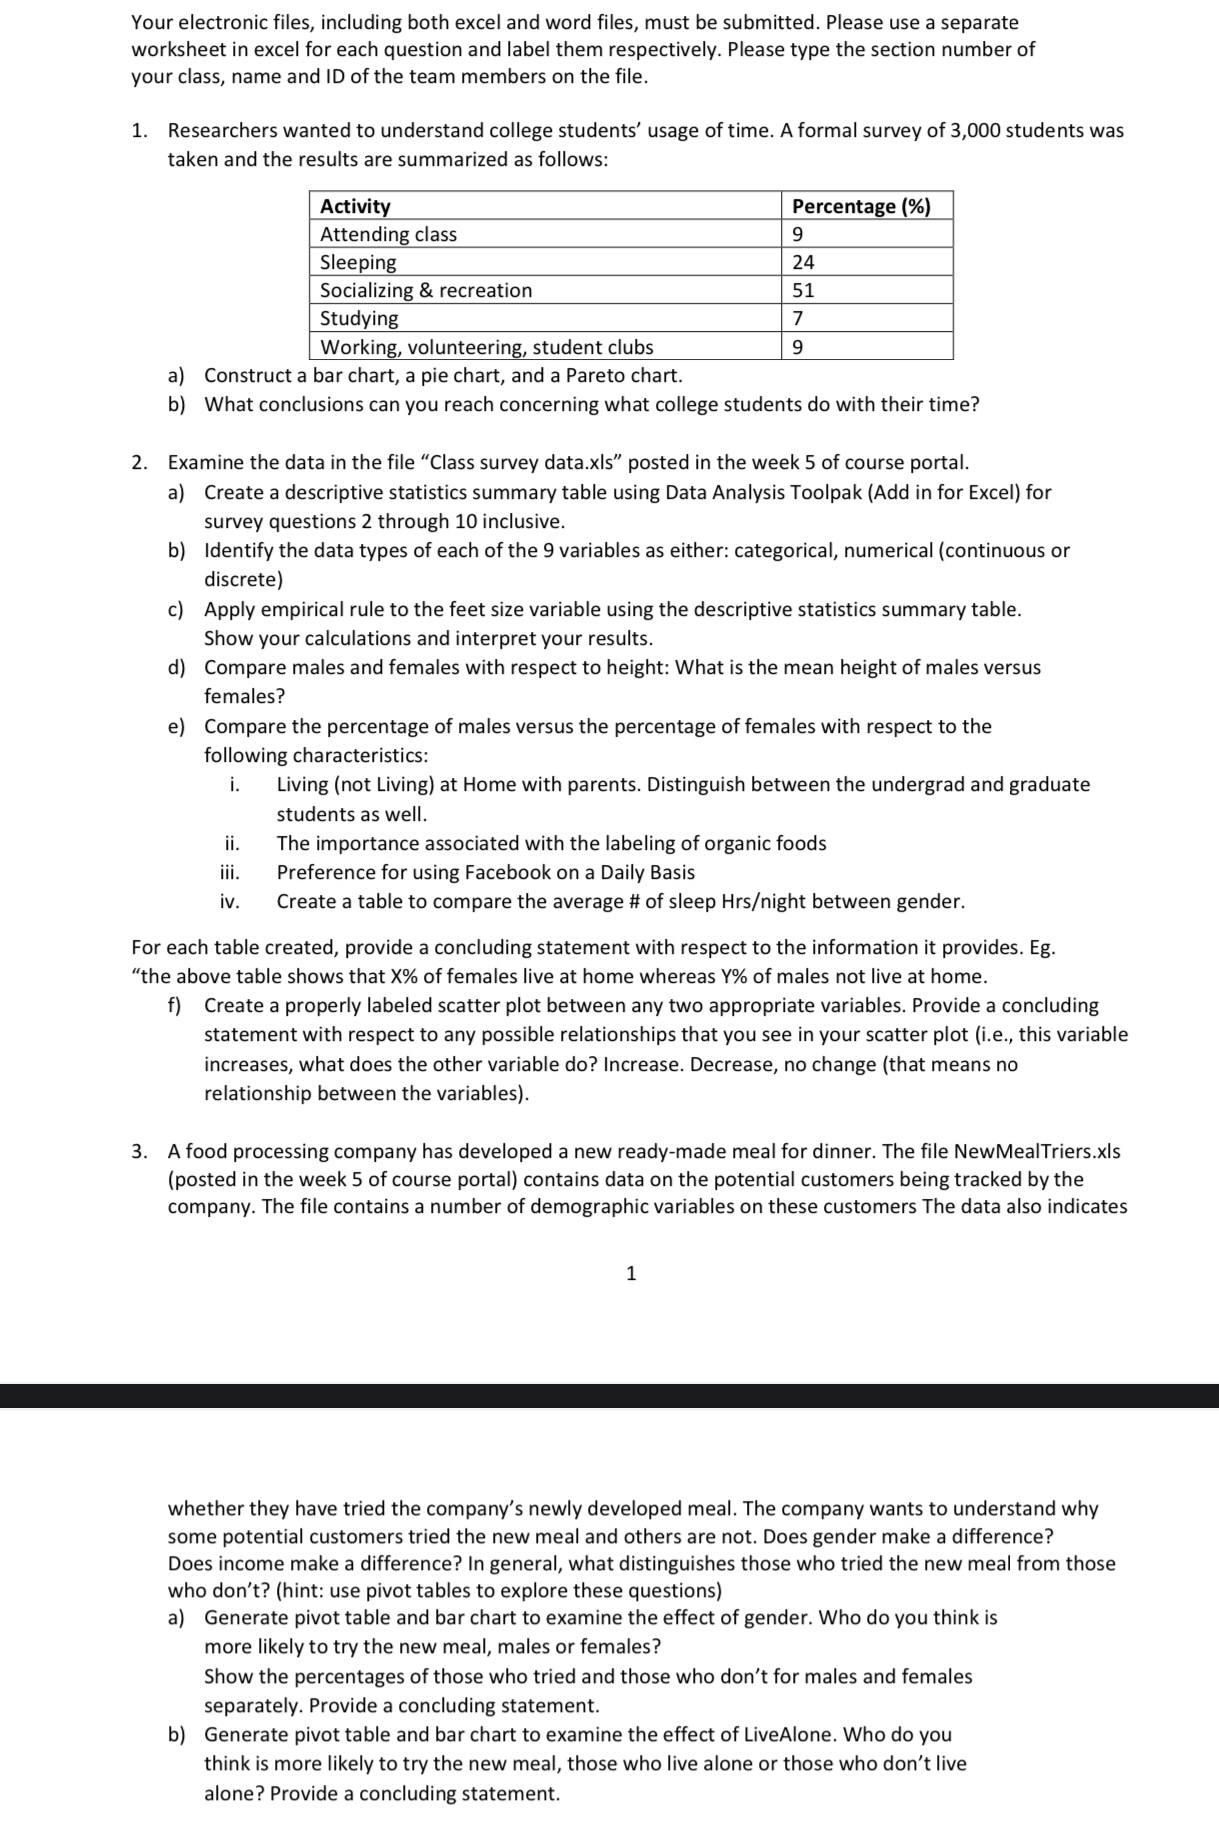
Your electronic files, including both excel and word files, must be submitted. Please use a separate worksheet in excel for each question and label them respectively. Please type the section number of your class, name and ID ofthe team members on the file. 1. Researchers wanted to understand college students' usage of time. A formal survey of 3,000 students was taken and the results are summarized as follows: Activity Percentage ('36) Attending class 9 Sleeping 24 Socializing & recreation 51 Studying 7 Working, volunteering, student clubs 9 3} Construct a bar chart, a pie chart, and a Pareto chart. b} What conclusions can you reach concerning what college students do with their time? 2. Examine the data in the file "Class survey data.xls\" posted in the week 5 of course portal. a} Create a descriptive statistics summary table using Data Analysis Toolpak [Add in for Excel} for survey questions 2 through 10 inclusive. b} Identify the data types of each ofthe 9 variables as either: categorical, numerical {continuous or discrete) c} Apply empirical rule to the feet size variable using the descriptive statistics summary table. Show your calculations and interpret your results. d} Compare males and females with respect to height: What is the mean height of males versus females? e) Compare the percentage of males versus the percentage of females with respect to the following characteristics: i. Living (not Living} at Home with parents. Distinguish between the undergrad and graduate students as well. ii. The importance associated with the labeling oforganic foods iii. Preference for using Facebook on a Daily Basis iv. Create a table to compare the average it of sleep Hrsight between gender. For each table created, provide a concluding statement with respect to the information it provides. Eg. \"the above table shows that X% of females live at home whereas Y% of males not live at home. f} Create a properly labeled scatter plot between any two appropriate variables. Provide a concluding statement with respect to any possible relationships that you see in your scatter plot (i.e., this variable increases, what does the other variable do? Increase. Decrease, no change [that means no relationship between the variables}. 3. A food processing company has developed a new ready~made meal for dinner. The le NewMealTriers.xls (posted in the week 5 of course portal} contains data on the potential customers being tracked bythe company. The file contains a number of demographic variables on these customers The data also indicates whether they have tried the company's newly developed meal. The company wants to understand why some potential customers tried the new meal and others are not. Does gender make a difference? Does income make a difference? In general, what distinguishes those who tried the new meal from those who don't? (hint: use pivot tables to explore these questions) 3} Generate pivot table and bar chart to examine the effect of gender. Who do you think is more likely to try the new meal, males or females? Show the percentages of those who tried and those who don't for males and females separately. Provide a concluding statement. b} Generate pivot table and bar chart to examine the effect of LiveAlone. Who do you think is more likely to try the new meal, those who live alone or those who don't live alone? Provide a concluding statement
Step by Step Solution
There are 3 Steps involved in it
Step: 1
Get Instant Access to Expert-Tailored Solutions
See step-by-step solutions with expert insights and AI powered tools for academic success
Step: 2
Step: 3
Ace Your Homework with AI
Get the answers you need in no time with our AI-driven, step-by-step assistance