Answered step by step
Verified Expert Solution
Question
1 Approved Answer
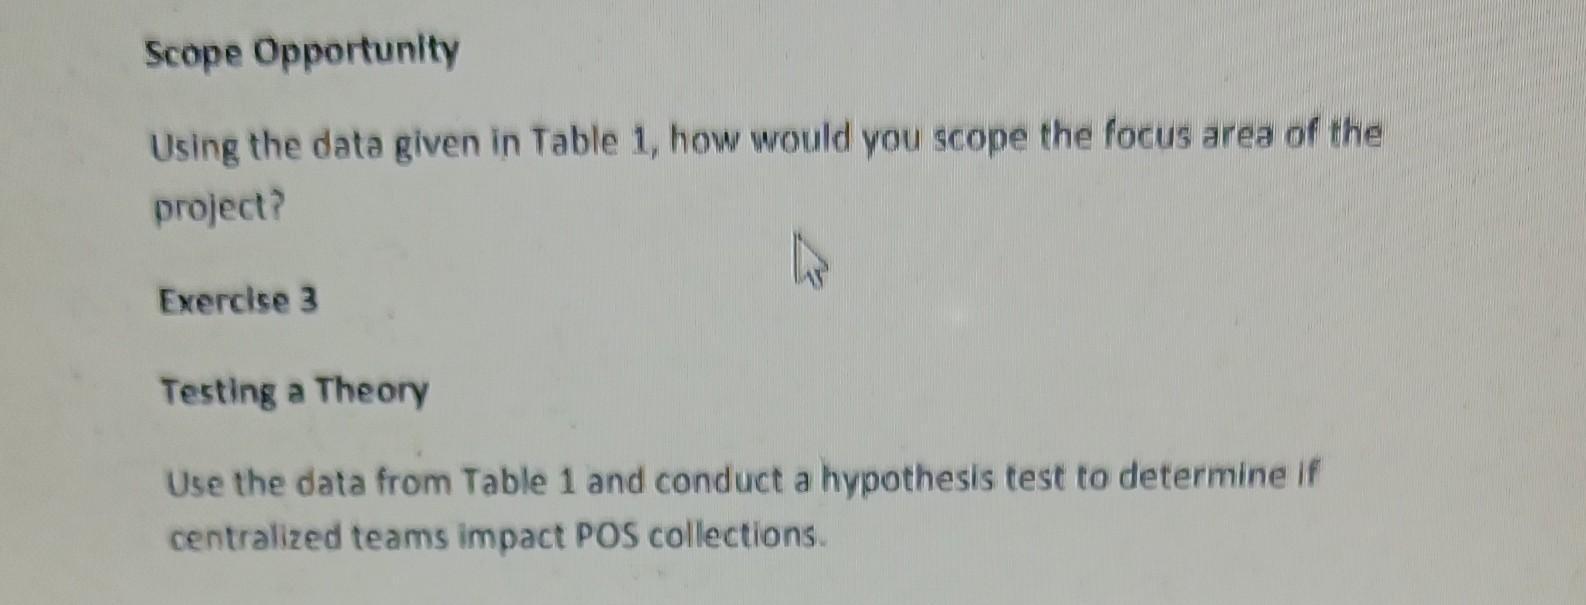
Scope Opportunity Using the data given in Table 1, how would you scope the focus area of the project? Exercise 3 Testing a Theory


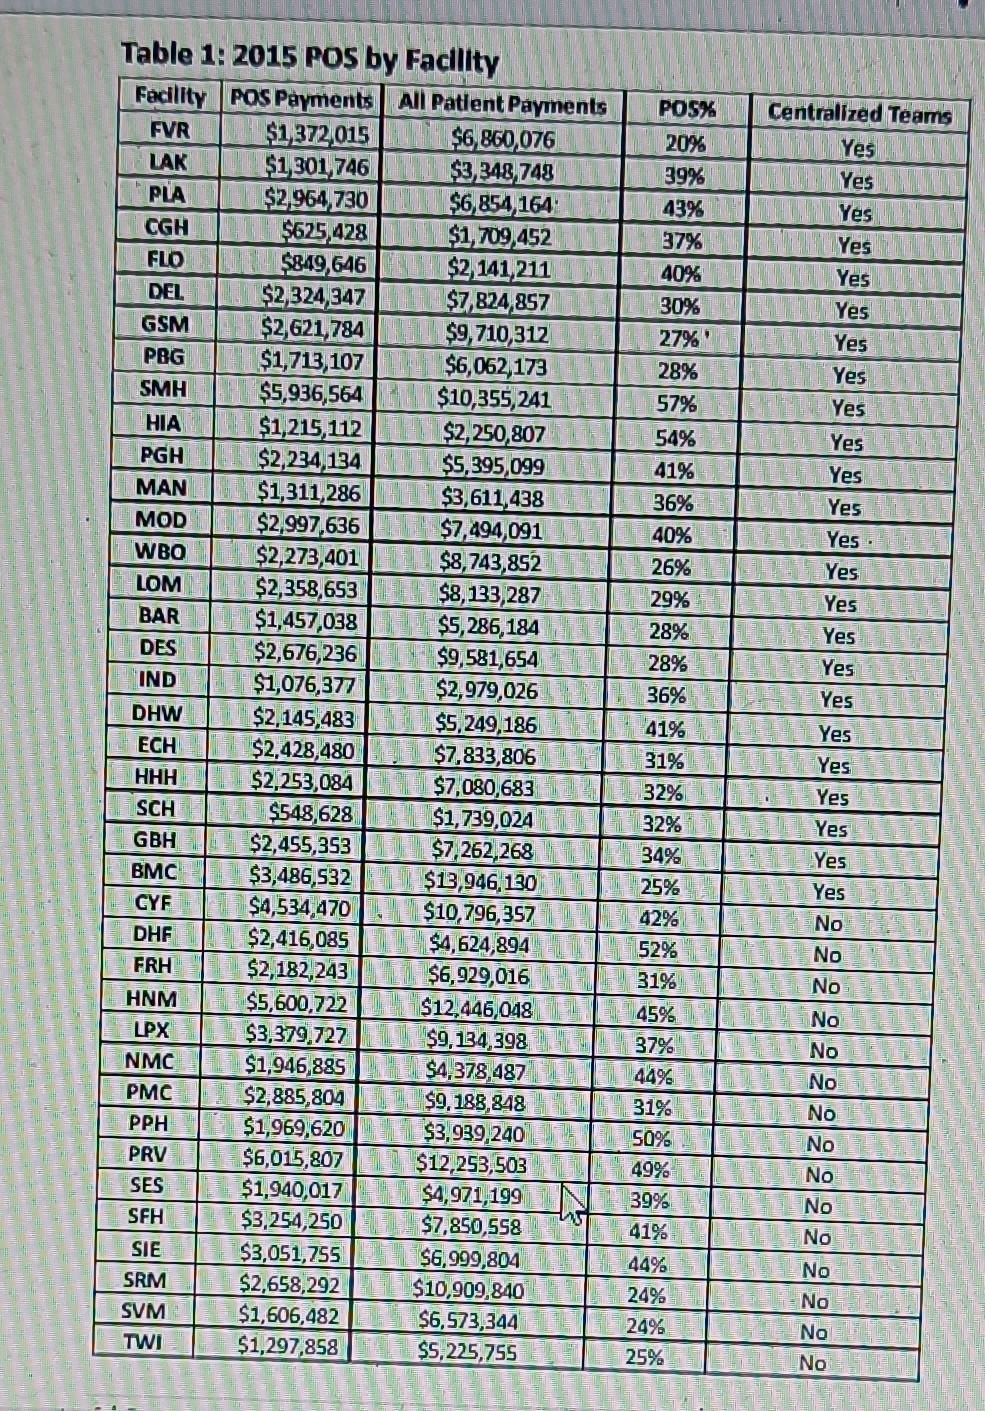
Scope Opportunity Using the data given in Table 1, how would you scope the focus area of the project? Exercise 3 Testing a Theory Use the data from Table 1 and conduct a hypothesis test to determine if centralized teams impact POS collections. Table 1: 2015 POS by Facility Facility POS Payments All Patient Payments FVR $1,372,015 LAK $1,301,746 PLA $2,964,730 CGH $625,428 FLO $849,646 DEL GSM PBG SMH HIA PGH MAN MOD WBO LOM BAR DES IND DHW ECH HHH SCH GBH BMC CYF DHF FRH HNM LPX NMC PMC PPH PRV SES SFH SIE SRM SVM TWI $2,324,347 $2,621,784 $1,713,107 $5,936,564 $1,215,112 $2,234,134 $1,311,286 $2,997,636 $2,273,401 $2,358,653 $1,457,038 $2,676,236 $1,076,377 $2,145,483 $2,428,480 $2,253,084 $548,628 $2,455,353 $3,486,532 $13,946,130 $4,534,470 $10,796,357 $2,416,085 $4,624,894 $2,182,243 $6,929,016 $12,446,048 $9,134,398 $4,378,487 $9,188,848 $3,939,240 $12,253,503 $4,971,199 $7,850,558 $5,600,722 $3,379,727 $1,946,885 $2,885,804 $1,969,620 $6,015,807 $1,940,017 $3,254,250 $6,860,076 $3,348,748 $6,854,164 $1,709,452 $2,141,211 $3,051,755 $2,658,292 $1,606,482 $1,297,858 $7,824,857 $9,710,312 $6,062,173 $10,355,241 $2,250,807 $5,395,099 $3,611,438 $7,494,091 $8,743,852 $8,133,287 $5,286,184 $9,581,654 $2,979,026 $5,249,186 $7,833,806 $7,080,683 $1,739,024 $7,262,268 $6,999,804 $10,909,840 $6,573,344 $5,225,755 144 45 POS% 20% 39% 43% 37% 40% 30% 27%' 28% 57% 54% 41% 36% 40% 26% 29% 28% 28% 36% 41% 31% 32% 32% 34% 25% 42% 52% 31% 45% 37% 44% 31% 50% 49% 39% 41% 44% 24% 24% 25% Centralized Teams Yes Yes Yes Yes Yes Yes Yes Yes Yes DA Yes Yes Yes Yes. Yes Yes Yes Yes Yes Yes Yes Yes Yes Yes Yes No No No No No No No No No No No No No No No how did centralized teams impact POS collection? how to conduct a hypothesis test in excel how would you scope the focus area of the project from the table?
Step by Step Solution
★★★★★
3.48 Rating (191 Votes )
There are 3 Steps involved in it
Step: 1
To scope the focus area of the project using the data from Table 1 it is necessary to identify patterns and trends in the data One approach could be t...
Get Instant Access to Expert-Tailored Solutions
See step-by-step solutions with expert insights and AI powered tools for academic success
Step: 2

Step: 3

Ace Your Homework with AI
Get the answers you need in no time with our AI-driven, step-by-step assistance
Get Started


