Answered step by step
Verified Expert Solution
Question
1 Approved Answer
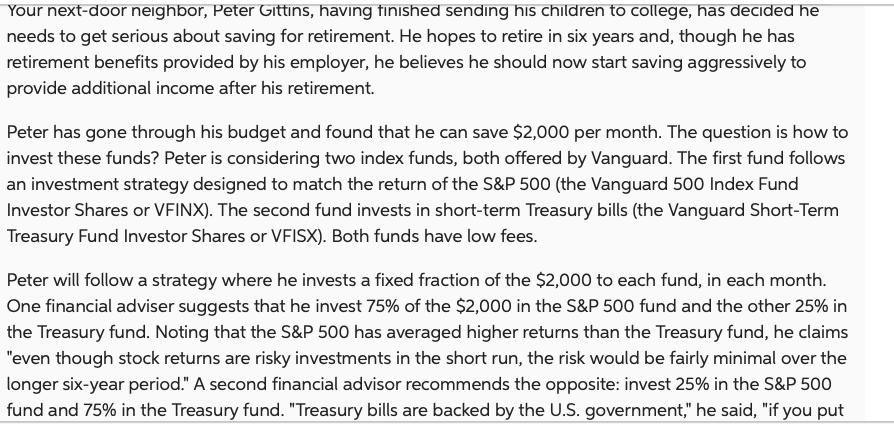
Your next-door neighbor, Peter Gittins, having finished sending his children to college, has decided he needs to get serious about saving for retirement. He


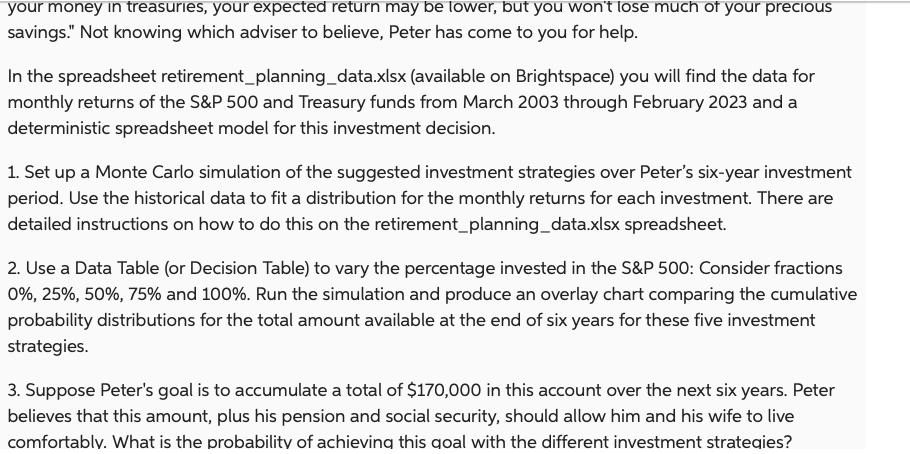
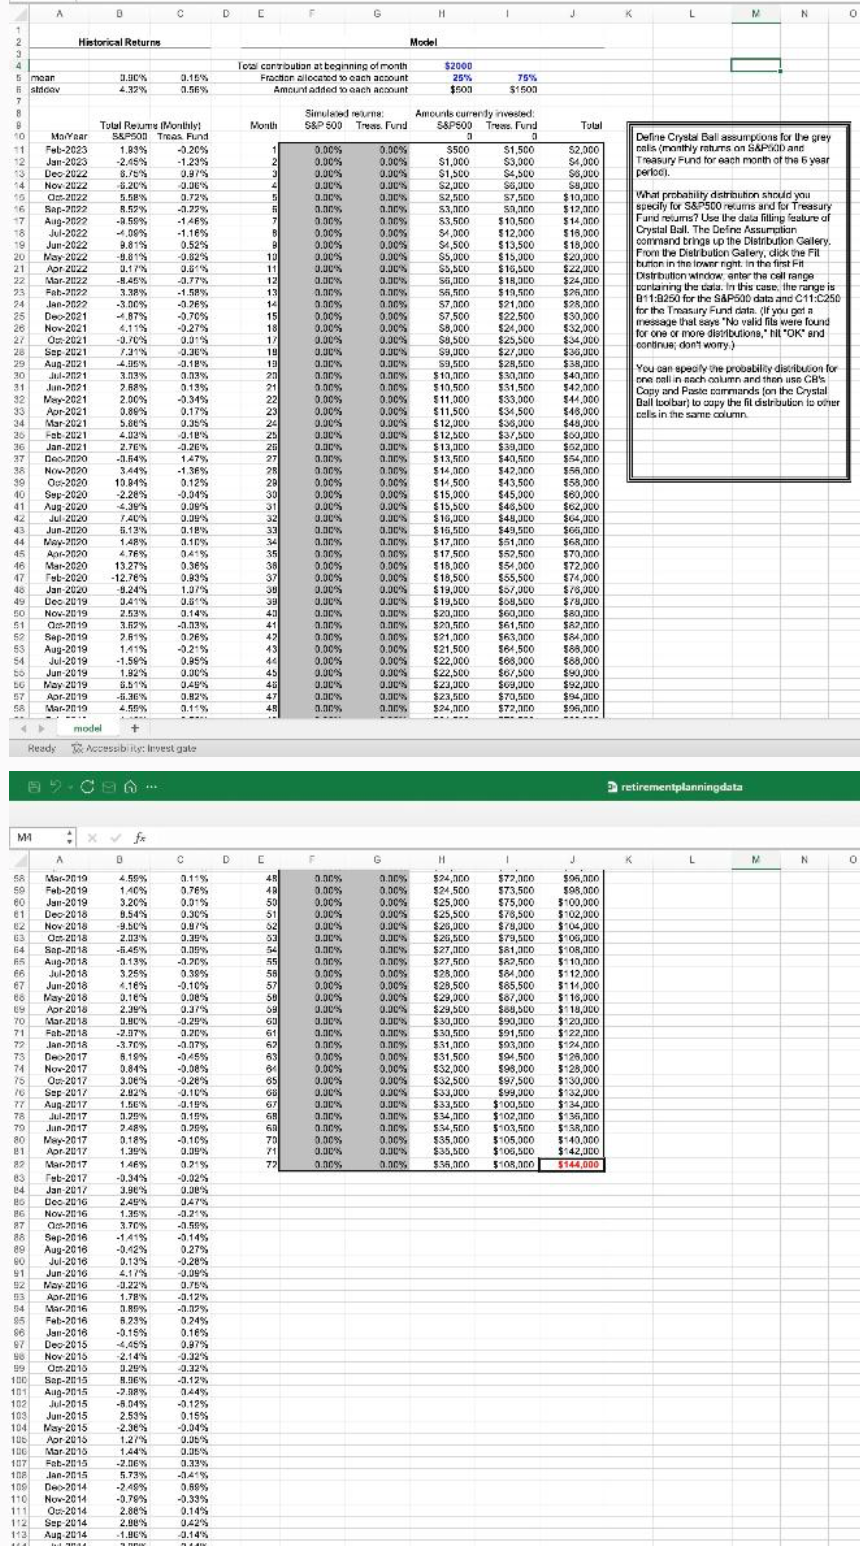
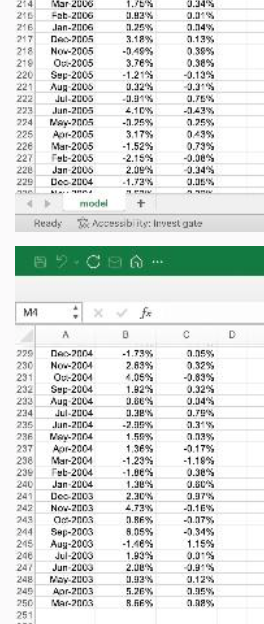
Your next-door neighbor, Peter Gittins, having finished sending his children to college, has decided he needs to get serious about saving for retirement. He hopes to retire in six years and, though he has retirement benefits provided by his employer, he believes he should now start saving aggressively to provide additional income after his retirement. Peter has gone through his budget and found that he can save $2,000 per month. The question is how to invest these funds? Peter is considering two index funds, both offered by Vanguard. The first fund follows an investment strategy designed to match the return of the S&P 500 (the Vanguard 500 Index Fund Investor Shares or VFINX). The second fund invests in short-term Treasury bills (the Vanguard Short-Term Treasury Fund Investor Shares or VFISX). Both funds have low fees. Peter will follow a strategy where he invests a fixed fraction of the $2,000 to each fund, in each month. One financial adviser suggests that he invest 75% of the $2,000 in the S&P 500 fund and the other 25% in the Treasury fund. Noting that the S&P 500 has averaged higher returns than the Treasury fund, he claims "even though stock returns are risky investments in the short run, the risk would be fairly minimal over the longer six-year period." A second financial advisor recommends the opposite: invest 25% in the S&P 500 fund and 75% in the Treasury fund. "Treasury bills are backed by the U.S. government," he said, "if you put your money in treasuries, your expected return may be lower, but you won't lose much of your precious savings." Not knowing which adviser to believe, Peter has come to you for help. In the spreadsheet retirement planning_data.xlsx (available on Brightspace) you will find the data for monthly returns of the S&P 500 and Treasury funds from March 2003 through February 2023 and a deterministic spreadsheet model for this investment decision. 1. Set up a Monte Carlo simulation of the suggested investment strategies over Peter's six-year investment period. Use the historical data to fit a distribution for the monthly returns for each investment. There are detailed instructions on how to do this on the retirement_planning_data.xlsx spreadsheet. 2. Use a Data Table (or Decision Table) to vary the percentage invested in the S&P 500: Consider fractions 0%, 25%, 50%, 75% and 100%. Run the simulation and produce an overlay chart comparing the cumulative probability distributions for the total amount available at the end of six years for these five investment strategies. 3. Suppose Peter's goal is to accumulate a total of $170,000 in this account over the next six years. Peter believes that this amount, plus his pension and social security, should allow him and his wife to live comfortably. What is the probability of achieving this goal with the different investment strategies? A B C D E 1 2 Historical Returns 3 4 5 mean stdcov 0.90% 4.32% 0.15% 0.56% 7 8 B Total Resume (Monthly Month Simulated returne S&P 500 Treas. Fund Total contribution at beginning of month Fraction allocated to each account Amount added to each account Amounts currendy invested: H J K M N 0 Model $2000 25% $500 75% $1500 S&P500 Tress. Fund Tulal 10 MaYear 11 Feb-2023 S&P500 1.83% Treas. Fund " -0.20% 0.00% 0.00% $500 $1,500 $2,000 12 Jan-2023 -2.45% -1.23% 0.00% 0.00% $1,000 $3,000 $4,000 13 Dec-2022 18.75% 0.97% 0.00% 0.00% $1,500 $4,500 $8,000 14 Nov-2022 5.20% -0.06% 0.00% 0.00% $2,000 $6,000 $8,000 10 Oct-20122 5.58% 0.72% 0.00% 0.00% $2,500 $7,500 $10,000 16 Sap-20122 8.52% -0.22% 0.00% 0.00% $3,000 50,000 17 Aug-2022 -0.50% -1.46% 0.00% 0.00% $3,500 $10,500 $12,000 $14,000 18 Jul-2022 -4.08% -1.16% 0.00% 0.00% $1,000 $12,000 $16,000 19 Jun-2022 9.81% 0.52% 0.00% 0.00% $4,500 $13,500 $18,000 20 May-2022 -9.81% -0.82% 10 0.00% 0.00% $5,000 $15,000 $20,000 21 Apr 2022 0.17% 0.81% 11 0.00% 0.00% $5,500 $16,500 $22,000 22 Mar-20122 -8.45% -0.77% 12 0.00% 0.00% $6,000 $18,000 $24,000 23 Feb-20122 3.38% -1.58% 0.00% 0.00% $5,500 $19,500 $25,000 24 Jan-2022 -3.00% -0.26% 14 0.00% 0.00% $7,000 $21,000 $28,000 25 Dec-2021 -4.87% -0.70% 15 0.00% 0.00% $7,500 $22,500 $30,000 26 Nov-2021 4.11% -0.27% 18 0.00% 0.00% $8,000 $24,000 $32,000 27 Oct-2021 -0.70% 0.01% 17 0.00% 0.00% $8,500 $25,500 $34,000 28 Sep-2021 7.31% -0.36% 19 0.00% 0.00% $9,000 $27,000 $36,000 29 Aug-2021 4.05% -0.18% 19 0.00% 0.00% $9,500 $28,500 $38,000 30 Jul-2021 3.13% 0.03% 20 0.00% 0.00% $10,000 $30,000 $40,000 31 Jun-2021 2.68% 0.13% 21 0.00% 0.00% $10,500 $31,500 $42,000 32 May-2021 2.00% -0.34% 22 0.00% 0.00% $11,000 $33,000 $44,000 33 Apr-2021 0.88% 0.17% 23 0.00% 0.00% $11,500 $34,500 $46,000 Define Crystal Ball assumptions for the grey calis (monthly returns on SAPSOD and Treasury Fund for each month of the 5 year perloc What probability distribution should you specify for S&P500 recums and for Treasury Fund resurs? Use the data filling feature of Crystal Ball. The Define Assumption command brings up the Distribution Gallery. From the Distribution Gallery, dick the Filt button in the lower right. In the first Fit Distribution window, enter the cell range containing the cats. In this case, the range is B11:8250 for the S&P500 data and C11:C250 for the Treasury Fund data. (If you get a message that says "No valid fils were found for one or more distributions," hit "OK" and continue; don't worry.) You can specify the probability distribution for one call in nach column and then use CB's Copy and Paste commands (on the Crystal Ball toolbar) to copy the fit distribution to other cells in the same column 34 Mar-2021 5.86% 0.35% 24 0.00% (0.00% $12,000 $36,000 $48,000 26 Feb-2021 4.03% -0.18% 25 0.00% 0.00% $12,500 $37,500 $60,000 36 Jan-2021 2.76% -0.26% 25 0.00% 0.00% $13,000 $39,000 $62,000 37 Dec-2020 -3.64% 1.47% 27 0.00% 0.00% $13,500 $40,500 $54,000 38 Nov-2020 3.44% -1.36% 28 0.00% 0.00% $14,000 $42,000 $58,000 39 Oc-2020 10.84% 0.12% 28 0.00% 0.00% $14,500 $43,500 $58,000 40 Sep-2020 -2.28% -0.04% 30 0.00% 0.00% $15,000 $45,000 $60,000 41 Aug-2020 4.39% 0.09% 31 0.00% 0.00% $15,500 $46,500 $62,000 42 Jul-2020 7.40% 0.09% 32 0.00% 0.00% $16,000 $48,000 $64,000 43 Jun-20120 5.13% 0.18% 33 0.00% 0.00% $16,500 $49,500 $66,000 44 May-20120 1.48% 0.10% 34 0.00% 0.00% $17,000 $51,000 $68,000 45 Apr-2020 4.76% 0.41% 35 0.00% 0.00% $17,500 $52,500 $70,000 46 Mar-2020 13.27% 0.36% 38 0.00% 0.00% $18,000 $54,000 $72,000 47 Feb-2020 -12.76% 0.93% 37 0.00% 0.00% $18,500 $55,500 $74,000 48 Jan-2020 -9.24% 1.07% 38 0.00% 0.00% $19,000 $57,000 $76,000 49 Dec 2019 0.41% 0.51% 39 0.00% 0.00% $19,500 $68,500 $78,000 50 Nov-2019 2.53% 0.14% 43 0.00% 0.00% $20,000 $60,000 $80,000 51 Oct-2019 3.62% -0.03% 41 0.00% 0.00% $20,500 $61,500 $82,000 52 Sep-2019 2.61% 0.26% 42 0.00% 0.00% $21,000 $63,000 $84,000 53 Aug-2019 1.41% -0.21% 43 0.00% 0.00% $21,500 $64,500 $88,000 54 Jul-2019 -1.50% 0.95% 44 0.00% 0.00% $22,000 $68,000 $88,000 56 Jun-2019 1.82% 0.00% 0.00% 0.00% $22,500 $67,500 $90,000 BG May 2019 6.51% 0.49% 45 0.00% 0.00% $23,000 $69,000 $92,000 57 Apr-2019 -6.36% 0.82% 47 0.30% 0.00% $23,500 $70,500 $94,000 58 Mar-2019 4.55% 0.11% 0.00% 0.00% $24,000 $72,000 $95,000 model Ready Accessibility: Invest gate retirementplanningdata M x fx A B C D [ H L M N 58 Mar-2019 4.50% 0.11% 48 0.00% 0.00% $24,000 $72,000 50 Feb-2019 1.40% 0.76% 48 0.00% 0.00% $24,500 $73,500 $95,000 $98,000 60 Jan-2019 3.20% 0.01% 50 0.00% 0.00% $25,000 $75,000 $100,000 81 Dec-2018 8.54% 0.30% 51 0.00% 0.00% $25,500 $78,500 $102,000 82 Nov-2018 -9.50% 0.97% 52 0.00% 0.00% $25,000 $78,000 $104,000 63 Oct-2018 2.03% 0.39% 53 0.00% 0.00% $26,500 $79,500 $105,000 64 Sap-2018 -5.45% 0.05% 54 0.00% 0.30% $27,000 $81,000 $108,000 65 Aug-2018 0.13% -0.20% 55 0.00% 0.00% $27,500 66 Jul-2018 3.25% 0.38% 58 0.00% 0.00% $28,000 67 Jun-2018 4.16% -0.10% 57 0.00% 0.00% $28,500 88 May-2018 0.16% 0.08% 58 0.00% 0.00% $29,000 89 Apr 2018 2.39% 0.37% 59 0.00% 0.00% $29,500 70 Mar-2018 0.90% -0.29% 60 0.00% 0.00% $30,000 71 Fab-2018 -2.07% 0.20% 61 0.00% 0.00% 72 Jan-2018 -3.70% -0.07% 62 0.00% 0.00% $30,500 $31,000 $82,500 584,000 $112,000 $85,500 $87,000 $88,500 $118,000 $90,000 $120,000 $91,500 $122,000 $110,000 $114,000 $116,000 73 Dec-2017 8.18% -0.45% 63 0.00% 0.00% $31,500 $93,000 $94.500 $128,000 $124,000 74 Nov-2017 0.84% -0.08% 64 0.00% 0.00% $32,000 75 O:2017 3.06% -0.28% 65 0.00% 0.00% $32,500 76 Sep-2017 2.02% -0.10% 0.00% 0.00% $33,000 77 Aug-2017 1.56% -0.19% 67 0.00% 0.00% 78 Jul-2017 0.29% 0.19% 68 0.00% 0.00% 79 Jun-2017 2.48 % 0.25% 60 0.00% 0.00% 80 May-2017 0.18% -0.10% 70 0.00% 0.00% 21 Apr-2017 1.39% 0.09% 71 0.00% 83 82 Mar-2017 Feb-2017 1.46% 0.21% 72 0.00% 0.00% 0.00% $98,000 $128,000 $97,500 $130,000 $99,000 $132,000 $33,500 $100,500 $134,000 $34,000 $102,000 $136,000 $34,500 $103,500 $138,000 $35,000 $105,000 $140,000 $35,500 $105,500 $142,000 $38,000 $108,000 $144,000 -0.34% -0.02% 24 Jan-2017 3.90% 0.00% 86 Dec-2016 2.49% 0.47% 86 Nov-2016 1.35% -0.21% 87 Oct-2016 3.70% -0.55% 88 Sep-2016 -1.41% -0.14% 89 Aug-2016 -0.12% 0.27% 60 Jul-2016 0.13% -0.28% 91 92 Jun-2016 May-2016 513 Apr-2016 4.17% -0.09% -0.22% 0.75% 1.78% -0.12% 54 Mar-2016 3.85% -0.02% 95 Feb-2016 8.23% 0.24% 86 Jan-2016 -0.15% 0.16% 97 Dec-2015 -4.45% 0.97% 98 Nov-2015 -2.14% -0.32% 99 Oct-2016 0.29% -0.32% 100 Sep-2015 8.36% -0.12% 101 Aug-2015 -2.08% 0.44% 102 Jul-2015 -8.04% -0.12% 103 Jun-2015 2.53% 0.15% 104 106 May-2015 -2.36% -0.04% Apr 2015 1.27% 0.06% 106 Mar-2016 1.44% 0.05% 107 Feb-2015 -2.06% 0.33% 108 Jan-2015 5.73% -0.41% 109 Dec-2014 -2.49% 0.69% 110 Nov-2014 -0.78% -0.33% 111 O:2014 2.88% 0.14% 113 112 Sep-2014 Aug-2014 2.00% 0.42% -1.86% -0.14% -1.00 .143 114 Jul-2014 3.99% 0.14% 115 Jan-2014 -0.07% -0.15% model Ready Accessibility: Investgate MA fx A B C D 115 Jun-2014 -0.07% -0.15% 116 May-2014 1.62% 0.04% 117 Apr-2014 2.33% 0.13% 118 Mar-2014 1.15% 0.26% 119 Feb-2014 0.40% -0.25% 120 Jan-2014 4.56% 0.04% 121 Dec 2013 2.97% 0.42% 122 Nov-2013 1.09% -0.43% 123 Om-2013 3.13% 0.13% 124 Sep-2013 5.08% 0.12% 125 Aug-2013 2.84% 0.40% 126 Jul-2013 -2.81% -0.18% 127 Jun-2013 5.57% 0.12% 128 May 2013 -1.82% -0.25% 129 Apr-2013 2.33% -0.34% 130 Mar-2013 2.36% 0.12% 131 Feb-2013 3.28% 0.03% 132 Jan-2013 1.34% 0.12% 133 Dec-2012 5.09% 0.47% 134 Nov-2012 0.21% -0.44% 136 Oct 2012 0.56% 0.12% 136 Sap-2012 -1.38% -0.16% 137 Aug-2012 2.18% 0.02% 138 Jul-2012 2.24 % 0.10% 139 Jun-2012 1.87% 0.33% 140 May-2012 3.80% -0.12% 141 Apr-2012 -8.02% 0.04% 142 Mar 2012 0.22% 0.52% 143 Feb-2012 2.86% -0.32% 144 Jan-2012 4.31% -0.14% 145 Dec-2011 5.06% 0.77% 146 Nov-2011 0.45% -0.31% 147 Out-2011 -0.23% -0.03% 148 Sep-2011 11.49% 0.15% 149 Aug-2011 -7.54% -0.22% 150 Jul-2011 -5.45% 0.52% 151 Jan-2011 -1.60% 0.52% 152 May-2011 -2.12% -0.04% 153 Apr-2011 -1.15% 0.52% 154 Mar-2011 3.38% 0.71% 155 Feb-2011 -0.39% -0.13% 156 Jan-2011 3.42% -0.22% 157 Dec-2010 2.79% 1.5% 158 Nov-2010 5.22% -1.87% 159 Oct-2010 0.00% -0.29% 180 Sep-2010 4.31% 0.27% 181 Aug-2010 8.37% 0.18% 182 Jul-2010 -4.53% 0.38% 163 Jun-2010 7.54% 0.38% 164 May-2010 -5.73% 0.58% 165 Apr-2010 -8.00% 0.37% 166 Mar-2010 1.99% 0.85% 187 Feb-2010 5.58% -0.82% 188 Jan-2010 3.09% 0.20% 189 Dec-2009 -2.99% 1.75% 170 Nov 2009 1.30% -1.99% 171 Oct-2009 5.08% 0.89% 172 Sep-2009 -1.38% 0.20% model Ready Accessibility: Invest gate MA A 172 Sep-2009 fx B C -1.38% 0.20% 173 Aug-2009 3.21% 0.37% 174 Jul-2009 3.60% 0.32% 175 Jun-2009 8.15% 0.20% 176 May-2009 -0.31% -0.16% 177 Apr-2009 5.82% 0.21% 178 Mar-2009 10.33% 0.82% 179 Feb-2009 8.02% 0.00% 180 Jan-2009 -13.66% 0.01% 181 Dec-2008 -7.81% 0.53% 182 Nov-2008 0.19% 0.56% 183 Oct-2008 -7.17% 1.05% 184 Sep-2008 -18.31% 0.53% 185 Aug-2008 -8.42% 0.58% 196 Jul-2008 1.46% 0.52% Jun-2008 -0.37% 0.52% 188 May-2008 189 Apr-2008 -8.88% 0.34% 1.28% -0.51% 180 Mar-2008 5.37% -0.76% 191 Feb-2008 -0.83% 0.07% 192 Jan-2008 -3.25% 1.14% 193 Dec-2007 -5.49% 2.04% 194 Nov-2007 -1.24% 0.25% 195 Oct-2007 4.15% 2.18% 196 Sep-2007 2.03% 0.44% 187 Aug-2007 3.27% 0.75% 188 Jul-2007 1.50% 1.16% 199 Jun-2007 -2.70% 1.05% 200 May 2007 -2.07 % 0.38% 201 Apr-2007 3.48% -0.41% 2012 Mar-2007 4.85% 0.48% 203 Fab-2007 0.65% 0.25% 204 Jan-2007 -1.87% 0.97% 205 Dec-2006 2.00% 0.18% 206 Nov-2006 0.90% -0.22% 207 208 O 2006 Sep-2006 1.00% 0.58% 3.69% 0.45% 205 Aug-2006 210 Jul-2006 2.12 % 2.36% 0.56% 0.76% 212 211 Jun-2006 May-2006 1.03% 0.75% -0.29% 0.24 % 213 Apr-2006 -2.90% 0.04% 214 Mar-2006 1.76% 0.34% 216 Feb-2006 3.83% 0.01% 214 Mar-2006 1.76% 0.34% 216 Feb-2006 3.83% 0.01% 216 Jan-2006 1.25% 0.04% 217 Dec-2005 3.18% 0.13% 218 Nov-2005 -0.49% 0.38% 219 Ou-2005 3.76% 0.38% 220 Sep-2005 -1.21% -0.13% 221 Aug-2006 0.32% -0.31% 222 Jul-2005 -0.01% 0.75% 223 Jun-2005 4.10 % -0.43% 224 May-2005 -0.25% 0.25% 225 Apr-2005 3.17% 0.43% 226 Mar-2005 -1.52% 0.73 % 227 Feb-2005 -2.15% -0.08% 228 Jan-2006 2.09% -0.34% 229 Dec-2004 -1.73% 0.05% asel model Ready Accessibility: Invest gate MA fx A B C D 229 Dec-2004 -1.73% 0.05% 230 Nov-2004 2.83% 0.32% 231 Ou-2004 4.05% -0.83% 232 Sep-2004 1.82% 0.32% 233 Aug-2004 0.66% 0.04% 234 Jul-2004 0.38% 0.79% 235 Jun-2004 -2.00% 0.31% 236 May-2004 1.50% 0.03% 237 Apr-2004 1.36 % -0.17% 238 Mar-2004 -1.23% -1.18% 239 Feb-2004 -1.06% 0.38% 240 Jan-2004 1.38% 0.80% 241 Dec-2003 2.30% 0.97% 242 Nov-2003 4.73% -0.16% 243 Oct-2003 0.86% -0.07% 244 Sep-2003 8.05% -0.34% 245 Aug-2003 -1.46% 1.15% 246 Jul-2003 1.93% 0.01% 247 Jun-2003 2.08% -0.91% 248 May-2003 0.93% 0.12% 249 Apr-2003 5.26% 0.95% 250 Mar-2003 8.66% 0.08% 251
Step by Step Solution
There are 3 Steps involved in it
Step: 1

Get Instant Access to Expert-Tailored Solutions
See step-by-step solutions with expert insights and AI powered tools for academic success
Step: 2

Step: 3

Ace Your Homework with AI
Get the answers you need in no time with our AI-driven, step-by-step assistance
Get Started


