

Answered step by step
Verified Expert Solution
Question
1 Approved Answer
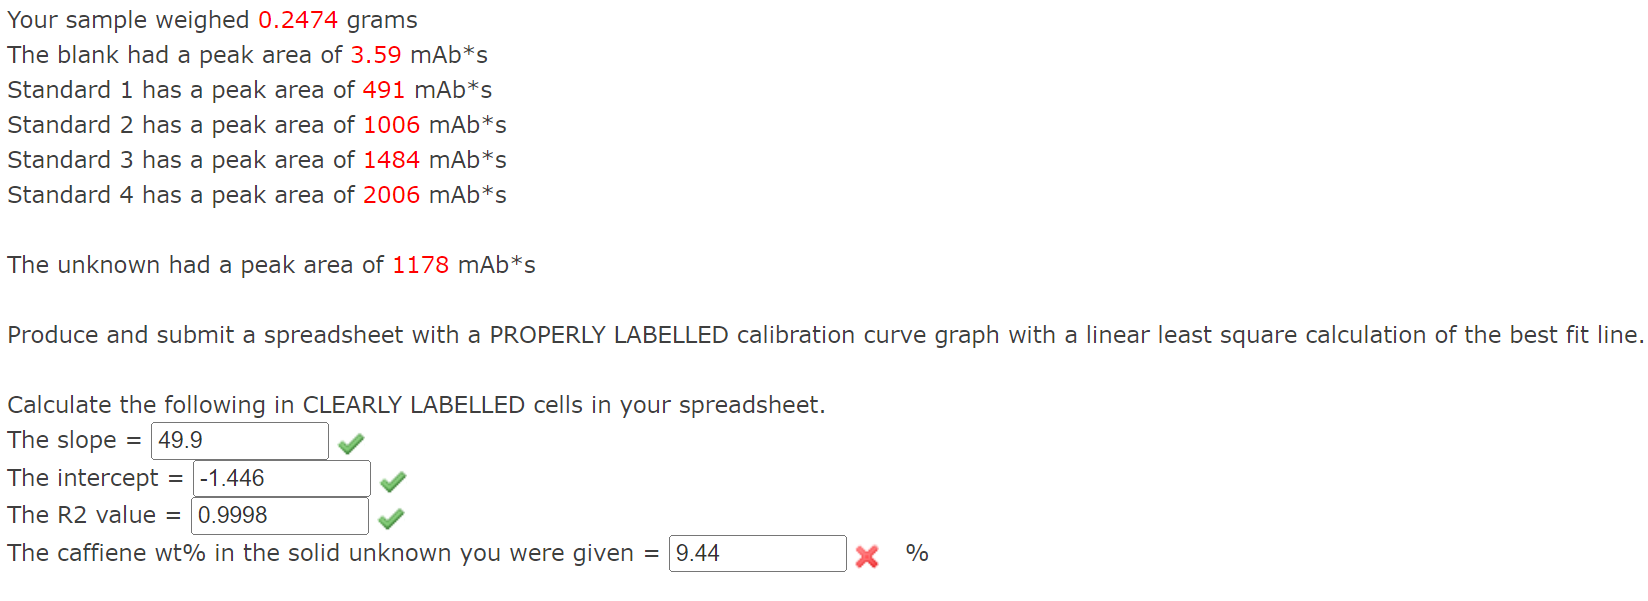
Your sample weighed 0.2474 grams The blank had a peak area of 3.59 mAb*s Standard 1 has a peak area of 491 mAb*s Standard 2
Step by Step Solution
There are 3 Steps involved in it
Step: 1

Get Instant Access to Expert-Tailored Solutions
See step-by-step solutions with expert insights and AI powered tools for academic success
Step: 2

Step: 3
Ace Your Homework with AI
Get the answers you need in no time with our AI-driven, step-by-step assistance
Get Started
Introduction To Software For Chemical Engineers
Authors: Mariano Martín Martín
2nd Edition
1138324213, 978-1138324213