Question
Your submission should cover the following: (1) Briefly, summarize the key facts of the case and identify the problem. State and explain the decision that
Your submission should cover the following:
(1) Briefly, summarize the key facts of the case and identify the problem. State and explain the decision that needs to be made.
An excellent report will demonstrate the ability to construct a clear and insightful problem statement while identifying all underlying issues.
(2) What are some approaches that can be used to solve this problem? What are some various criteria or metrics that can be used to help make this decision?
An excellent report will propose and examine approaches and criteria that are based on theory and sensitive to all the identified issues.
(3) State your recommendation supported by rationale.
An excellent report will propose solutions that are sensitive to all the identified issues and supported by reasons and rationale. It will include an evaluation of solutions containing thorough and insightful explanations, feasibility of solutions, and impacts of solutions.
(4) Briefly state the limitations of the approach you used in making this decision, and outline what further analysis you would recommend.
An excellent report will provide concise yet thorough action-oriented recommendations using appropriate subject-matter justifications related to the problem while addressing limitations of the solution and outlining recommended future analysis.
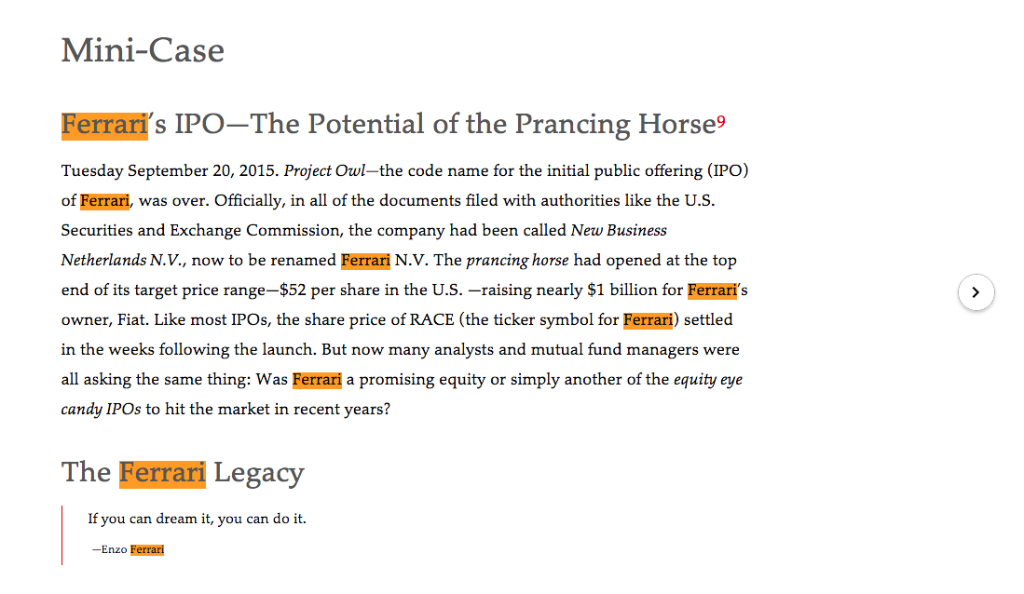
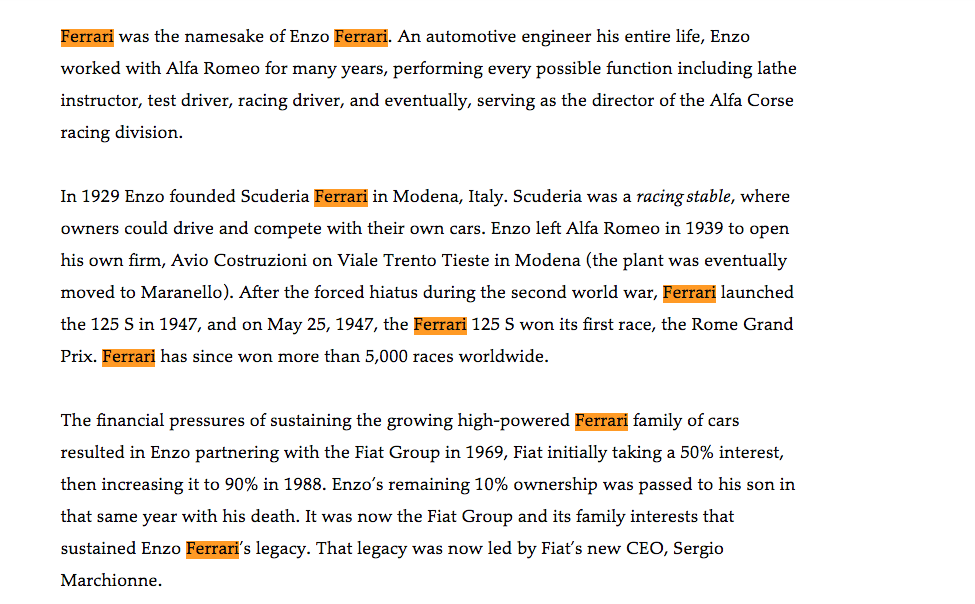
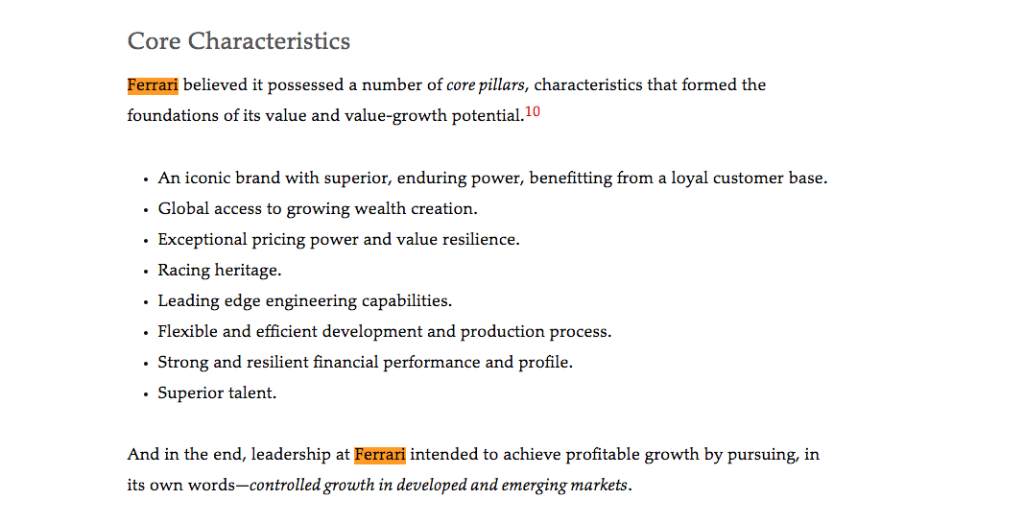
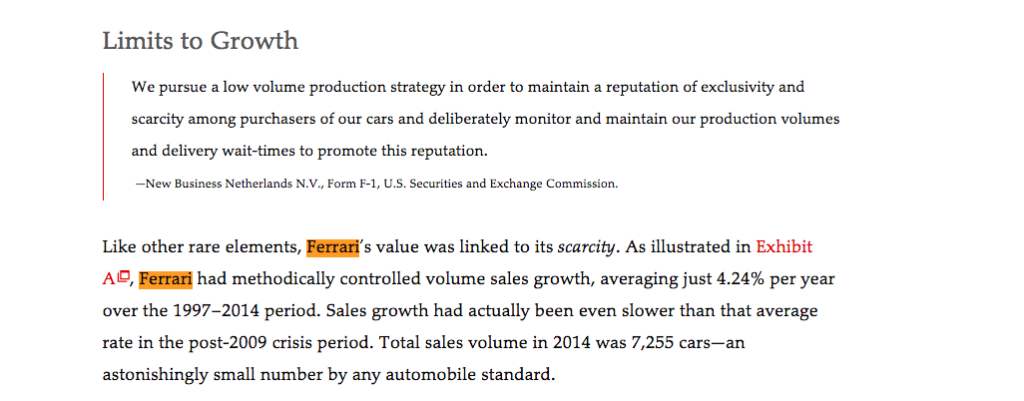
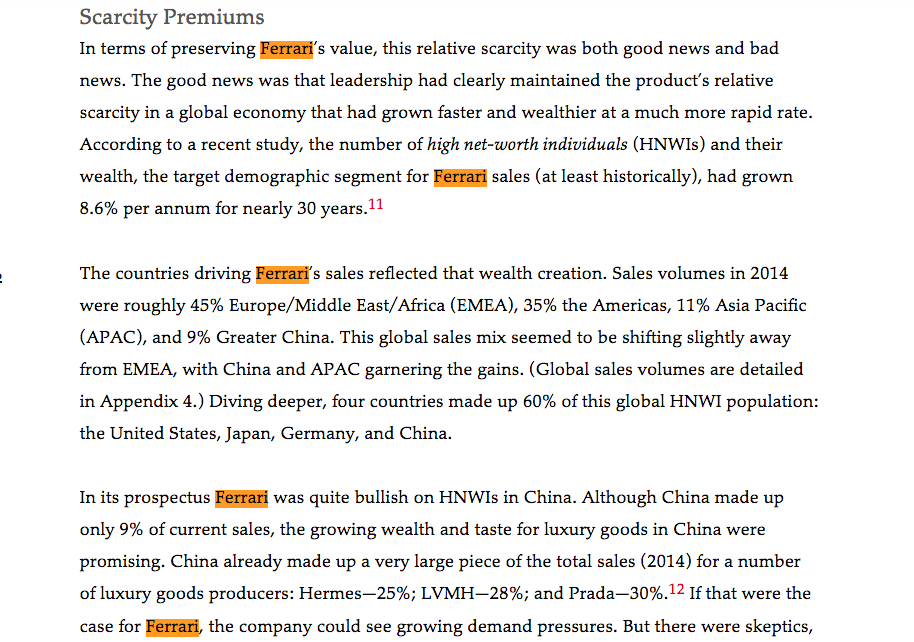
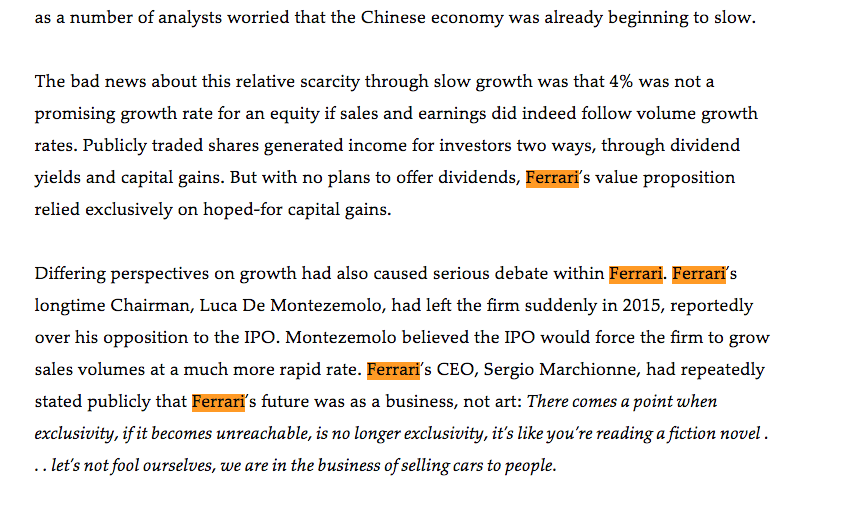
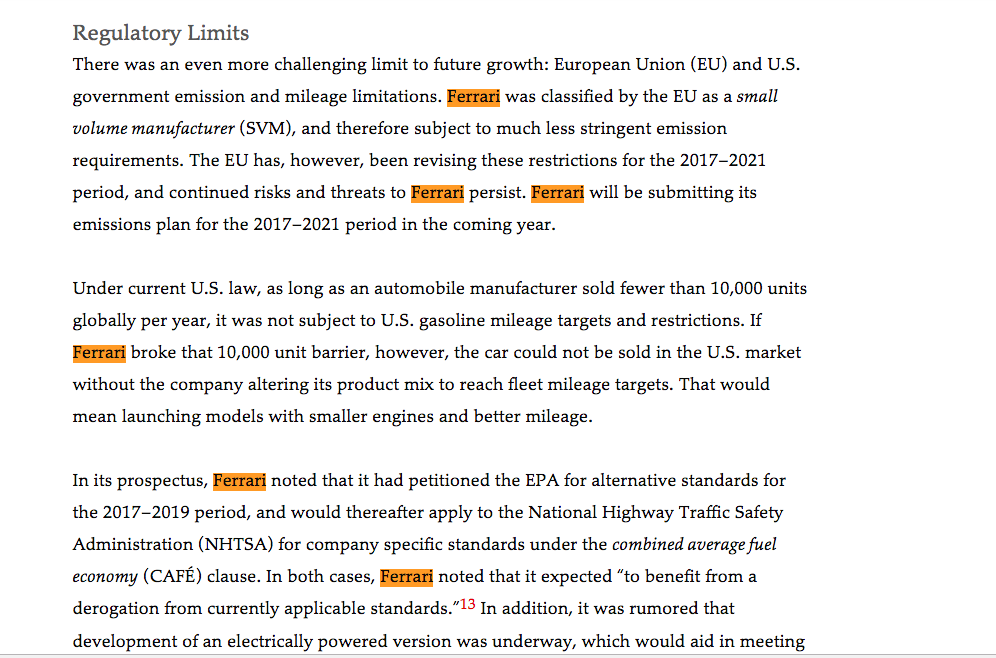
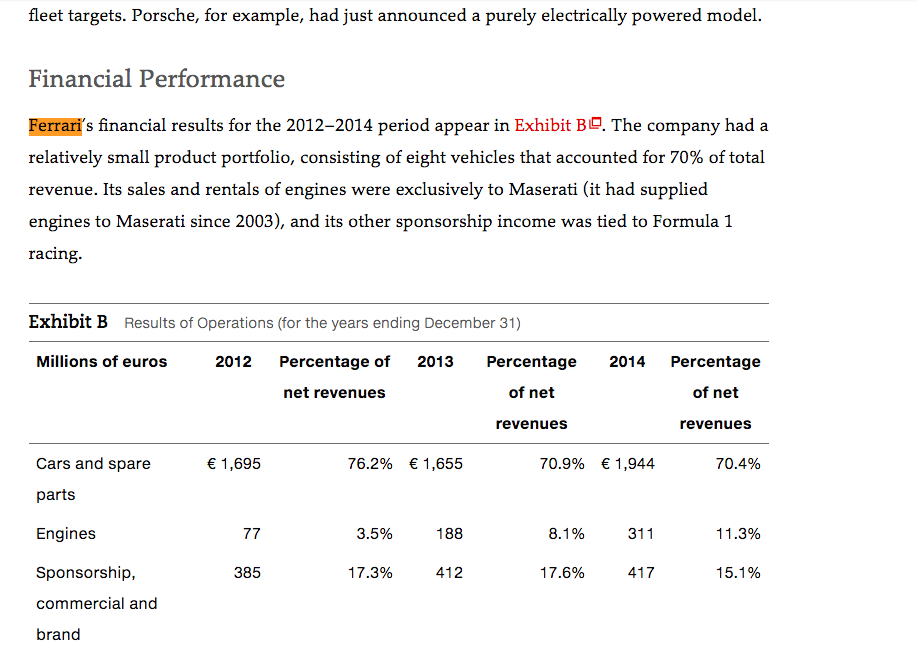
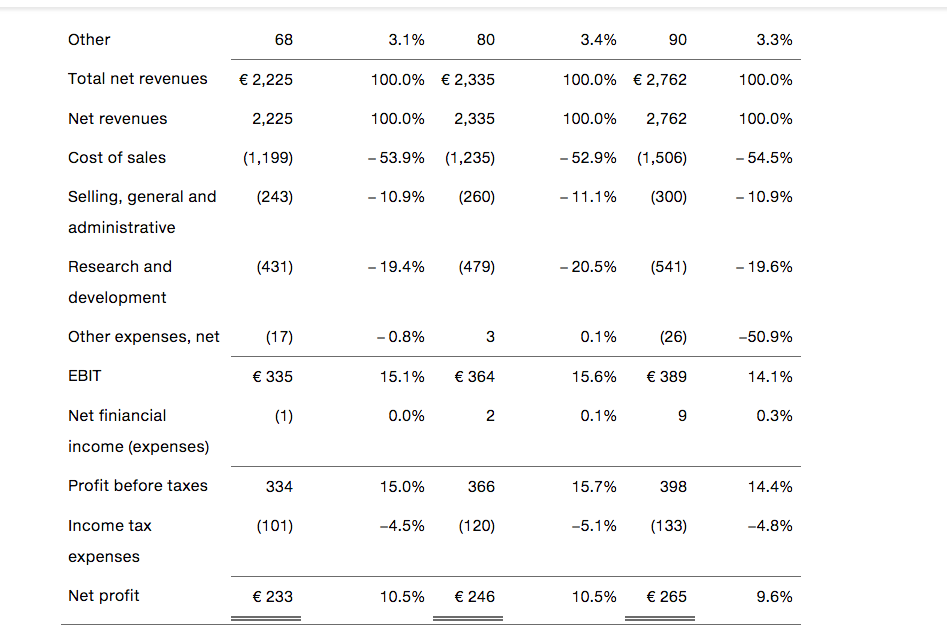
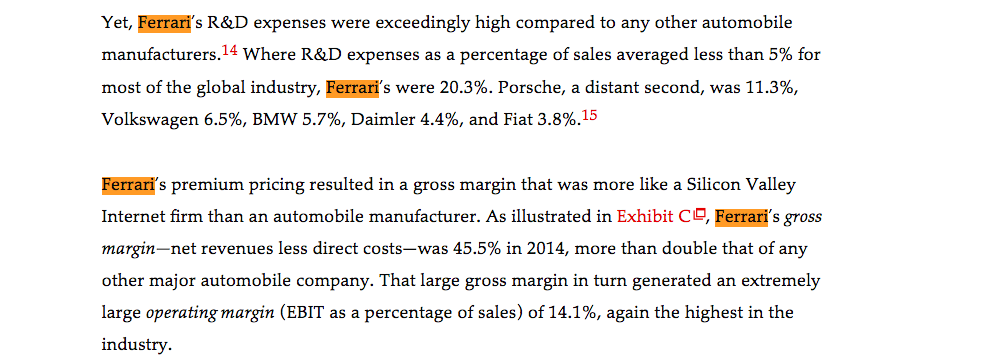
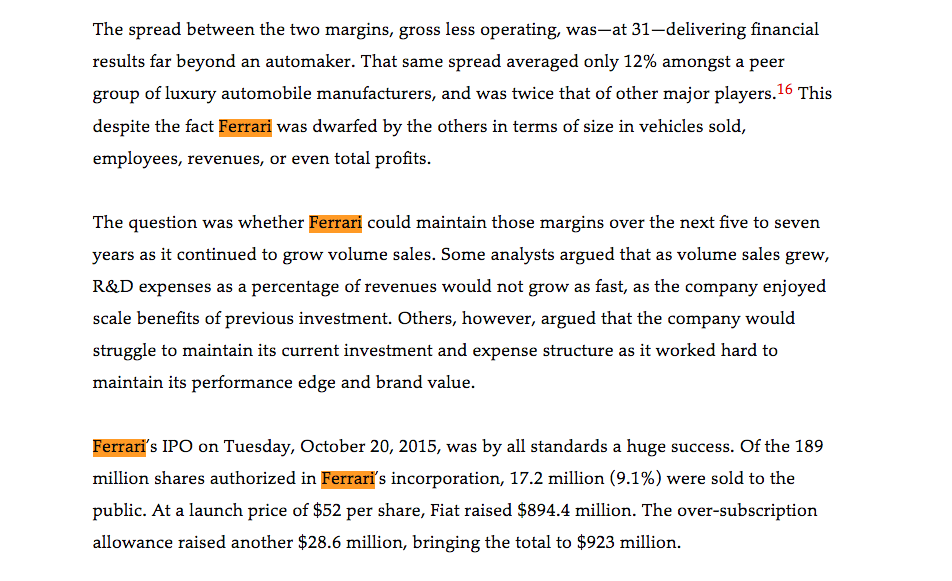
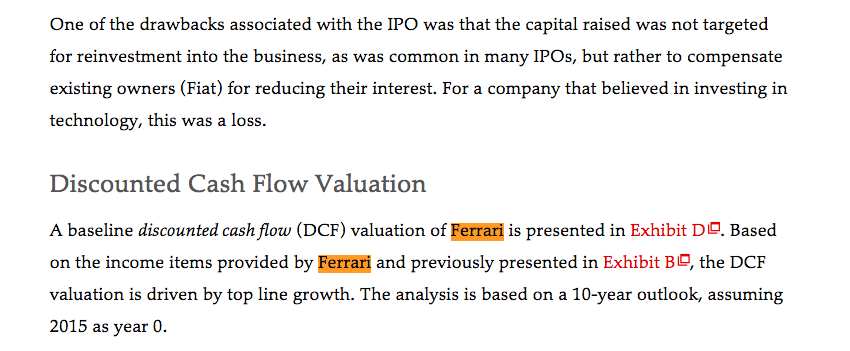
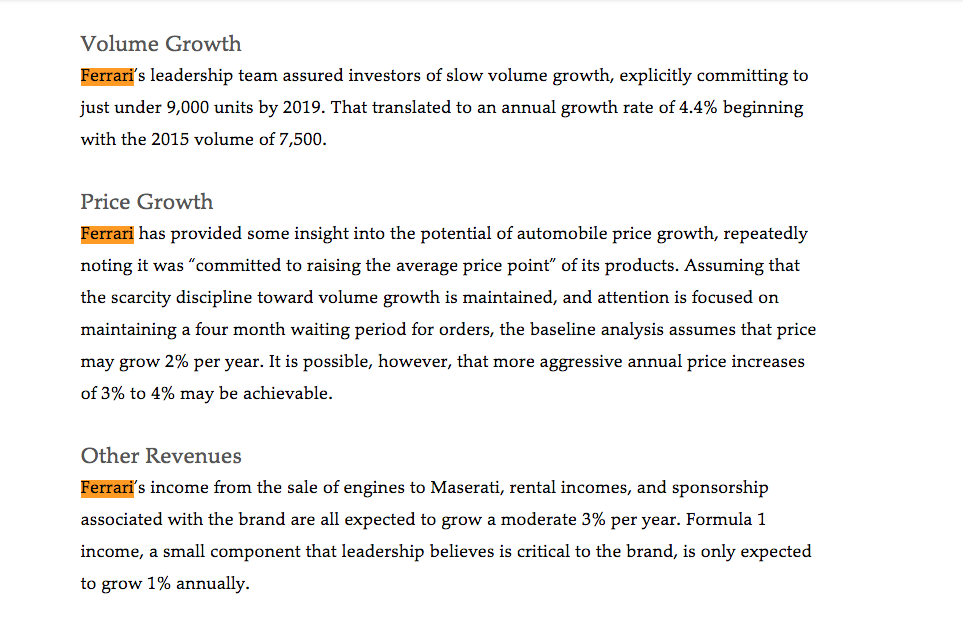
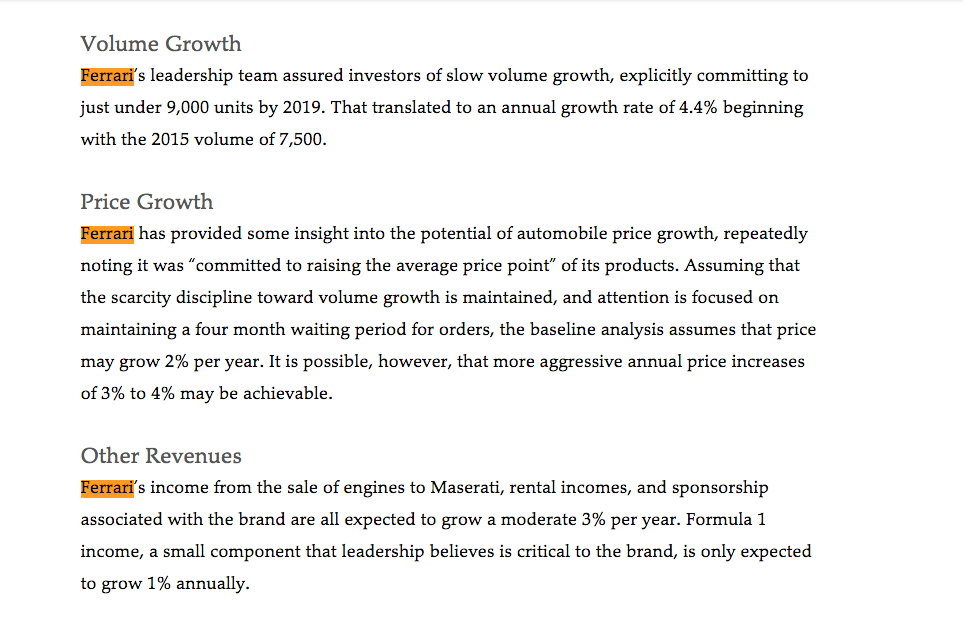
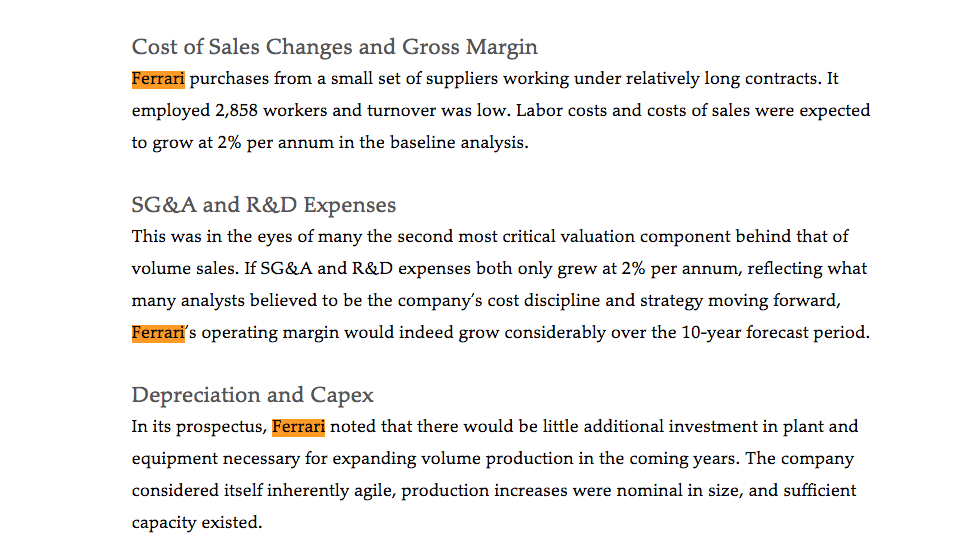
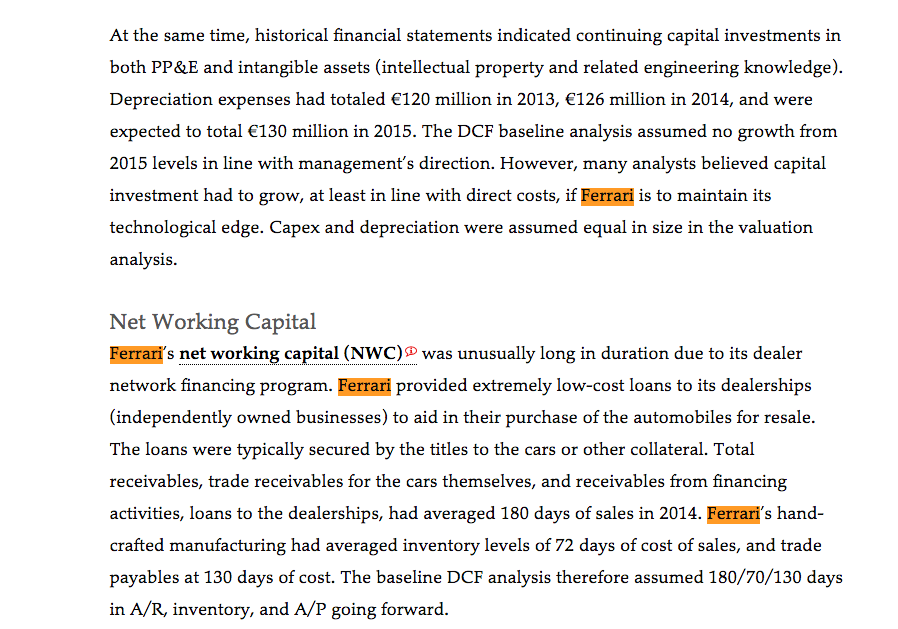
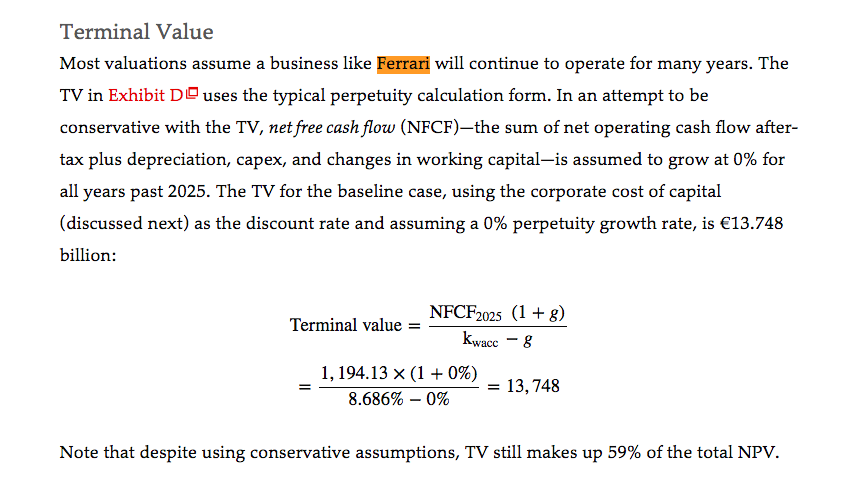
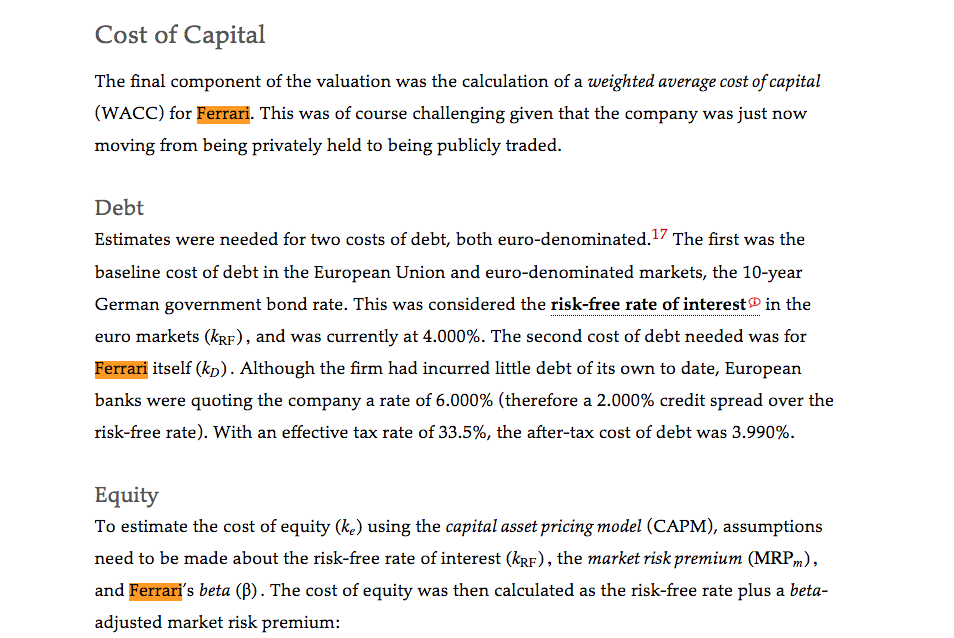
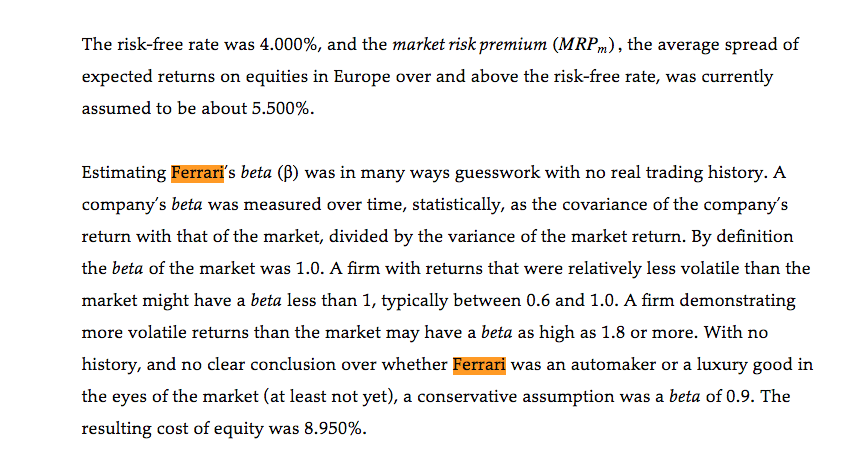
Mini-Case Ferrari's IPO-The Potential of the Prancing Horse9 Tuesday September 20, 2015. Project Owl-the code name for the initial public offering (IPO) of Ferrari, was over. Officially, in all of the documents filed with authorities like the U.S. Securities and Exchange Commission, the company had been called New Business Netherlands N.V., now to be renamed Ferrari N.V. The prancing horse had opened at the top end of its target price range-$52 per share in the U.S.-aisng nearly $1blion for Ferrart owner, Fiat. Like most IPOs, the share price of RACE (the ticker symbol for Ferrari) settled in the weeks following the launch. But now many analysts and mutual fund managers were all asking the same thing: Was Ferrari a promising equity or simply another of the equity eye candy IPOs to hit the market in recent years? The Ferrari Legacy If you can dream it, you can do it. Enzo Ferrari Ferrari was the namesake of Enzo Ferrari. An automotive engineer his entire life, Enzo worked with Alfa Romeo for many years, performing every possible function including lathe instructor, test driver, racing driver, and eventually, serving as the director of the Alfa Corse racing division In 1929 Enzo founded Scuderia Ferrari in Modena, Italy. Scuderia was a racing stable, where owners could drive and compete with their own cars. Enzo left Alfa Romeo in 1939 to open his own firm, Avio Costruzioni on Viale Trento Tieste in Modena (the plant was eventually moved to Maranello). After the forced hiatus during the second world war, Ferrari launched the 125 S in 1947, and on May 25, 1947, the Ferrari 125 S won its first race, the Rome Grand Prix. Ferrari has since won more than 5,000 races worldwide. The financial pressures of sustaining the growing high-powered Ferrari family of cars resulted in Enzo partnering with the Fiat Group in 1969, Fiat initially taking a 50% interest, then increasing it to 90% in 1988, Enzo's remaining 10% ownership was passed to his son in that same year with his death. It was now the Fiat Group and its family interests that sustained Enzo Ferrari's legacy. That legacy was now led by Fiat's new CEO, Sergio Marchionne. Core Characteristics Ferrari believed it possessed a number of core pillars, characteristics that formed the foundations of its value and value-growth potential.10 An iconic brand with superior, enduring power, benefitting from a loyal customer base. Global access to growing wealth creation Exceptional pricing power and value resilience. Racing heritage. . Leading edge engineering capabilities Flexible and efficient development and production process. Strong and resilient financial performance and profile Superior talent. And in the end, leadership at Ferrari intended to achieve profitable growth by pursuing in its own words-controlled growth in developed and emerging markets Limits to Growth We pursue a low volume production strategy in order to maintain a reputation of exclusivity and scarcity among purchasers of our cars and deliberately monitor and maintain our production volumes and delivery wait-times to promote this reputation New Business Netherlands N.V., Form F-1, U.S. Securities and Exchange Commission Like other rare elements, Ferrari's value was linked to its scarcity. As illustrated in Exhibit AG, Ferrat had methodically controlled volume sales growth, averaging just 4.24% per year over the 1997-2014 period. Sales growth had actually been even slower than that average rate in the post-2009 crisis period. Total sales volume in 2014 was 7,255 cars-an astonishingly small number by any automobile standard Scarcity Premiums In terms of preserving Ferrari's value, this relative scarcity was both good news and bad news. The good news was that leadership had clearly maintained the product's relative scarcity in a global economy that had grown faster and wealthier at a much more rapid rate. According to a recent study, the number of high net-worth individuals (HNWIs) and their wealth, the target demographic segment for Ferrari sales (at least historically), had grown 8.6% per annum. for nearly 30 years.11 The countries driving Ferrari's sales reflected that wealth creation. Sales volumes in 2014 were roughly 45% Europe/Middle East/Africa (EMEA), 35% the Americas, 11% Asia Pacific (APAC), and 9% Greater China. This global sales mix seemed to be shifting slightly away from EMEA, with China and APAC garnering the gains. (Global sales volumes are detailed in Appendix 4.) Diving deeper, four countries made up 60% of this global HNWI population: the United States, Japan, Germany, and China. In its prospectus Ferrari was quite bullish on HNWIs in China. Although China made up only 9% of current sales, the growing wealth and taste for luxury goods in China were promising. China already made up a very large piece of the total sales (2014) for a number of luxury goods producers: Hermes-25%; LVMH-28%; and Prada-30%.12 If that were the case for Ferrari, the company could see growing demand pressures. But there were skeptics as a number of analysts worried that the Chinese economy was already beginning to slow. The bad news about this relative scarcity through slow growth was that 4% was not a promising growth rate for an equity if sales and earnings did indeed follow volume growth rates. Publicly traded shares generated income for investors two ways, through dividend yields and capital gains. But with no plans to offer dividends, Ferrari's value propositiorn relied exclusively on hoped-for capital gains Differing perspectives on growth had also caused serious debate within Ferrari. Ferraris longtime Chairman, Luca De Montezemolo, had left the firm suddenly in 2015, reportedly over his opposition to the IPO. Montezemolo believed the IPO would force the firm to grow sales volumes at a much more rapid rate. Ferrari's CEO, Sergio Marchionne, had repeatedly stated publicly that Ferrari's future was as a business, not art: There comes a point when exclusivity, ifit becomes unreachable, is no longer exclusivity, it's like you're reading a fiction novel .. let's not fool ourselves, we are in the business of selling cars to people. fleet targets. Porsche, for example, had just announced a purely electrically powered model. Financial Performance Ferrari's financial results for the 2012-2014 period appear in Exhibit BD. The company hada relatively small product portfolio, consisting of eight vehicles that accounted for 70% of total revenue. Its sales and rentals of engines were exclusively to Maserati (it had supplied engines to Maserati since 2003), and its other sponsorship income was tied to Formula 1 racing Exhibit B Results of Operations (for the years ending December 31) Millions of euros 2012 Percentage of 2013 Percentage 2014 Percentage of net of net net revenues revenues revenues 1,695 Cars and spare parts Engines Sponsorship, commercial and brand 76.2% 1,655 70.9% 1,944 70.4% 11 .3% 3.5% 8.1 % 311 188 15.1 % 17.3% 385 412 417 17.6% Other 68 Total net revenues 2,225 2,225 (1,199) (243) 3.1% 100.0% 100.0% -53.9% -10.9% 80 2,335 2,335 (1,235) (260) 3.4% 100.0% 100.0% -52.9% -11.1% 90 2,762 2,762 (1,506) (300) 33% 100.0% 100.0% -54.5% -10.9% Net revenues Cost of sales Selling, general and administrative Research and development Other expenses, net EBIT Net finiancial income (expenses) Profit before taxes (431) -19.4% (479) -20.5% (541) -19.6% -0.8% 15.1% 0.0% (17) 3 364 2 0.1% 15.6% 0.1% (26) 389 9 50.9% 14.1% 0.3% 335 15.0% 398 334 366 15.7% 14.4% -4.8% Income tax (101) -4.5% (120) -5.1% (133) expenses Net profit 233 10.5% 246 10.5% 265 Yet, Ferrari's R&D expenses were exceedingly high compared to any other automobile manufacturers. 14 where R&D expenses as a percentage of sales averaged less than 5% for most of the global industry, Ferrari's were 20.3%. Porsche, a distant second, was 11.3%. Volkswagen 6.5%, BMW 57% Daimler 4.4%, and Fiat 3.8%.15 Ferrari's premium pricing resulted in a gross margin that was more like a Silicon Valley Internet firm than an automobile manufacturer. As illustrated in Exhibit C, Ferrari's gross margin-net revenues less direct costs-was 45.5% in 2014, more than double that of any other major automobile company. That large gross margin in turn generated an extremely large operating margin (EBIT as a percentage of sales) of 14.1%, again the highest in the industry. The spread between the two margins, gross less operating, was-at 31-delivering financial results far beyond an automaker. That same spread averaged only 12% amongst a peer group of luxury automobile manufacturers, and was twice that of other major players,.16 This despite the fact Ferrari was dwarfed by the others in terms of size in vehicles sold, employees, revenues, or even total profits. The question was whether Ferrari could maintain those margins over the next five to seven years as it continued to grow volume sales. Some analysts argued that as volume sales grew, R&D expenses as a percentage of revenues would not grow as fast, as the company enjoyed scale benefits of previous investment. Others, however, argued that the company would struggle to maintain its current investment and expense structure as it worked hard to maintain its performance edge and brand value. Ferrari's IPO on Tuesday, October 20, 2015, was by all standards a huge success. Of the 189 million shares authorized in Ferrari's incorporation, 17.2 million (9.1%) were sold to the public. At a launch price of $52 per share, Fiat raised $894.4 million. The over-subscription allowance raised another $28.6 million, bringing the total to $923 million. One of the drawbacks associated with the IPO was that the capital raised was not targeted for reinvestment into the business, as was common in many IPOs, but rather to existing owners (Fiat) for reducing their interest. For a company that believed in investing irn technology, this was a loss Discounted Cash Flow Valuation A baseline discounted cash flow (DCF) valuation of Ferrari is presented in Exhibit D. Based on the income items provided by Ferrari and previously presented in Exhibit BO, the DCF valuation is driven by top line growth. The analysis is based on a 10-year outlook, assuming 2015 as year 0 Volume Growth Ferrari's leadership team assured investors of slow volume growth, explicitly committing to just under 9,000 units by 2019. That translated to an annual growth rate of 4.4% beginning with the 2015 volume of 7,500. Price Growth Ferrari has provided some insight into the potential of automobile price growth, repeatedly noting it was "committed to raising the average price point" of its products. Assuming that the scarcity discipline toward volume growth is maintained, and attention is focused on maintaining a four month waiting period for orders, the baseline analysis assumes that price may grow 2% per year. It is possible, however, that more aggressive annual price increases of 3% to 4% may be achievable. Other Revenues Ferrari's income from the sale of engines to Maserati, rental incomes, and sponsorship associated with the brand are all expected to grow a moderate 3% per year. Formula 1 income, a small component that leadership believes is critical to the brand, is only expected to grow 1% annually. Cost of Sales Changes and Gross Margin Ferrari purchases from a small set of suppliers working under relatively long contracts. It employed 2,858 workers and turnover was low. Labor costs and costs of sales were expected to grow at 2% per annum in the baseline analysis. SG&A and R&D Expenses This was in the eyes of many the second most critical valuation component behind that of volume sales. If SG&A and R&D expenses both only grew at 2% per annum, reflecting what many analysts believed to be the company's cost discipline and strategy moving forward, Ferrari's operating margin would indeed grow considerably over the 10-year forecast period. Depreciation and Capex In its prospectus, Ferrari noted that there would be little additional investment in plant and nt necessary for expanding volume production in the coming years. The company considered itself inherently agile, production increases were nominal in size, and sufficient capacity existed. Mini-Case Ferrari's IPO-The Potential of the Prancing Horse9 Tuesday September 20, 2015. Project Owl-the code name for the initial public offering (IPO) of Ferrari, was over. Officially, in all of the documents filed with authorities like the U.S. Securities and Exchange Commission, the company had been called New Business Netherlands N.V., now to be renamed Ferrari N.V. The prancing horse had opened at the top end of its target price range-$52 per share in the U.S.-aisng nearly $1blion for Ferrart owner, Fiat. Like most IPOs, the share price of RACE (the ticker symbol for Ferrari) settled in the weeks following the launch. But now many analysts and mutual fund managers were all asking the same thing: Was Ferrari a promising equity or simply another of the equity eye candy IPOs to hit the market in recent years? The Ferrari Legacy If you can dream it, you can do it. Enzo Ferrari Ferrari was the namesake of Enzo Ferrari. An automotive engineer his entire life, Enzo worked with Alfa Romeo for many years, performing every possible function including lathe instructor, test driver, racing driver, and eventually, serving as the director of the Alfa Corse racing division In 1929 Enzo founded Scuderia Ferrari in Modena, Italy. Scuderia was a racing stable, where owners could drive and compete with their own cars. Enzo left Alfa Romeo in 1939 to open his own firm, Avio Costruzioni on Viale Trento Tieste in Modena (the plant was eventually moved to Maranello). After the forced hiatus during the second world war, Ferrari launched the 125 S in 1947, and on May 25, 1947, the Ferrari 125 S won its first race, the Rome Grand Prix. Ferrari has since won more than 5,000 races worldwide. The financial pressures of sustaining the growing high-powered Ferrari family of cars resulted in Enzo partnering with the Fiat Group in 1969, Fiat initially taking a 50% interest, then increasing it to 90% in 1988, Enzo's remaining 10% ownership was passed to his son in that same year with his death. It was now the Fiat Group and its family interests that sustained Enzo Ferrari's legacy. That legacy was now led by Fiat's new CEO, Sergio Marchionne. Core Characteristics Ferrari believed it possessed a number of core pillars, characteristics that formed the foundations of its value and value-growth potential.10 An iconic brand with superior, enduring power, benefitting from a loyal customer base. Global access to growing wealth creation Exceptional pricing power and value resilience. Racing heritage. . Leading edge engineering capabilities Flexible and efficient development and production process. Strong and resilient financial performance and profile Superior talent. And in the end, leadership at Ferrari intended to achieve profitable growth by pursuing in its own words-controlled growth in developed and emerging markets Limits to Growth We pursue a low volume production strategy in order to maintain a reputation of exclusivity and scarcity among purchasers of our cars and deliberately monitor and maintain our production volumes and delivery wait-times to promote this reputation New Business Netherlands N.V., Form F-1, U.S. Securities and Exchange Commission Like other rare elements, Ferrari's value was linked to its scarcity. As illustrated in Exhibit AG, Ferrat had methodically controlled volume sales growth, averaging just 4.24% per year over the 1997-2014 period. Sales growth had actually been even slower than that average rate in the post-2009 crisis period. Total sales volume in 2014 was 7,255 cars-an astonishingly small number by any automobile standard Scarcity Premiums In terms of preserving Ferrari's value, this relative scarcity was both good news and bad news. The good news was that leadership had clearly maintained the product's relative scarcity in a global economy that had grown faster and wealthier at a much more rapid rate. According to a recent study, the number of high net-worth individuals (HNWIs) and their wealth, the target demographic segment for Ferrari sales (at least historically), had grown 8.6% per annum. for nearly 30 years.11 The countries driving Ferrari's sales reflected that wealth creation. Sales volumes in 2014 were roughly 45% Europe/Middle East/Africa (EMEA), 35% the Americas, 11% Asia Pacific (APAC), and 9% Greater China. This global sales mix seemed to be shifting slightly away from EMEA, with China and APAC garnering the gains. (Global sales volumes are detailed in Appendix 4.) Diving deeper, four countries made up 60% of this global HNWI population: the United States, Japan, Germany, and China. In its prospectus Ferrari was quite bullish on HNWIs in China. Although China made up only 9% of current sales, the growing wealth and taste for luxury goods in China were promising. China already made up a very large piece of the total sales (2014) for a number of luxury goods producers: Hermes-25%; LVMH-28%; and Prada-30%.12 If that were the case for Ferrari, the company could see growing demand pressures. But there were skeptics as a number of analysts worried that the Chinese economy was already beginning to slow. The bad news about this relative scarcity through slow growth was that 4% was not a promising growth rate for an equity if sales and earnings did indeed follow volume growth rates. Publicly traded shares generated income for investors two ways, through dividend yields and capital gains. But with no plans to offer dividends, Ferrari's value propositiorn relied exclusively on hoped-for capital gains Differing perspectives on growth had also caused serious debate within Ferrari. Ferraris longtime Chairman, Luca De Montezemolo, had left the firm suddenly in 2015, reportedly over his opposition to the IPO. Montezemolo believed the IPO would force the firm to grow sales volumes at a much more rapid rate. Ferrari's CEO, Sergio Marchionne, had repeatedly stated publicly that Ferrari's future was as a business, not art: There comes a point when exclusivity, ifit becomes unreachable, is no longer exclusivity, it's like you're reading a fiction novel .. let's not fool ourselves, we are in the business of selling cars to people. fleet targets. Porsche, for example, had just announced a purely electrically powered model. Financial Performance Ferrari's financial results for the 2012-2014 period appear in Exhibit BD. The company hada relatively small product portfolio, consisting of eight vehicles that accounted for 70% of total revenue. Its sales and rentals of engines were exclusively to Maserati (it had supplied engines to Maserati since 2003), and its other sponsorship income was tied to Formula 1 racing Exhibit B Results of Operations (for the years ending December 31) Millions of euros 2012 Percentage of 2013 Percentage 2014 Percentage of net of net net revenues revenues revenues 1,695 Cars and spare parts Engines Sponsorship, commercial and brand 76.2% 1,655 70.9% 1,944 70.4% 11 .3% 3.5% 8.1 % 311 188 15.1 % 17.3% 385 412 417 17.6% Other 68 Total net revenues 2,225 2,225 (1,199) (243) 3.1% 100.0% 100.0% -53.9% -10.9% 80 2,335 2,335 (1,235) (260) 3.4% 100.0% 100.0% -52.9% -11.1% 90 2,762 2,762 (1,506) (300) 33% 100.0% 100.0% -54.5% -10.9% Net revenues Cost of sales Selling, general and administrative Research and development Other expenses, net EBIT Net finiancial income (expenses) Profit before taxes (431) -19.4% (479) -20.5% (541) -19.6% -0.8% 15.1% 0.0% (17) 3 364 2 0.1% 15.6% 0.1% (26) 389 9 50.9% 14.1% 0.3% 335 15.0% 398 334 366 15.7% 14.4% -4.8% Income tax (101) -4.5% (120) -5.1% (133) expenses Net profit 233 10.5% 246 10.5% 265 Yet, Ferrari's R&D expenses were exceedingly high compared to any other automobile manufacturers. 14 where R&D expenses as a percentage of sales averaged less than 5% for most of the global industry, Ferrari's were 20.3%. Porsche, a distant second, was 11.3%. Volkswagen 6.5%, BMW 57% Daimler 4.4%, and Fiat 3.8%.15 Ferrari's premium pricing resulted in a gross margin that was more like a Silicon Valley Internet firm than an automobile manufacturer. As illustrated in Exhibit C, Ferrari's gross margin-net revenues less direct costs-was 45.5% in 2014, more than double that of any other major automobile company. That large gross margin in turn generated an extremely large operating margin (EBIT as a percentage of sales) of 14.1%, again the highest in the industry. The spread between the two margins, gross less operating, was-at 31-delivering financial results far beyond an automaker. That same spread averaged only 12% amongst a peer group of luxury automobile manufacturers, and was twice that of other major players,.16 This despite the fact Ferrari was dwarfed by the others in terms of size in vehicles sold, employees, revenues, or even total profits. The question was whether Ferrari could maintain those margins over the next five to seven years as it continued to grow volume sales. Some analysts argued that as volume sales grew, R&D expenses as a percentage of revenues would not grow as fast, as the company enjoyed scale benefits of previous investment. Others, however, argued that the company would struggle to maintain its current investment and expense structure as it worked hard to maintain its performance edge and brand value. Ferrari's IPO on Tuesday, October 20, 2015, was by all standards a huge success. Of the 189 million shares authorized in Ferrari's incorporation, 17.2 million (9.1%) were sold to the public. At a launch price of $52 per share, Fiat raised $894.4 million. The over-subscription allowance raised another $28.6 million, bringing the total to $923 million. One of the drawbacks associated with the IPO was that the capital raised was not targeted for reinvestment into the business, as was common in many IPOs, but rather to existing owners (Fiat) for reducing their interest. For a company that believed in investing irn technology, this was a loss Discounted Cash Flow Valuation A baseline discounted cash flow (DCF) valuation of Ferrari is presented in Exhibit D. Based on the income items provided by Ferrari and previously presented in Exhibit BO, the DCF valuation is driven by top line growth. The analysis is based on a 10-year outlook, assuming 2015 as year 0 Volume Growth Ferrari's leadership team assured investors of slow volume growth, explicitly committing to just under 9,000 units by 2019. That translated to an annual growth rate of 4.4% beginning with the 2015 volume of 7,500. Price Growth Ferrari has provided some insight into the potential of automobile price growth, repeatedly noting it was "committed to raising the average price point" of its products. Assuming that the scarcity discipline toward volume growth is maintained, and attention is focused on maintaining a four month waiting period for orders, the baseline analysis assumes that price may grow 2% per year. It is possible, however, that more aggressive annual price increases of 3% to 4% may be achievable. Other Revenues Ferrari's income from the sale of engines to Maserati, rental incomes, and sponsorship associated with the brand are all expected to grow a moderate 3% per year. Formula 1 income, a small component that leadership believes is critical to the brand, is only expected to grow 1% annually. Cost of Sales Changes and Gross Margin Ferrari purchases from a small set of suppliers working under relatively long contracts. It employed 2,858 workers and turnover was low. Labor costs and costs of sales were expected to grow at 2% per annum in the baseline analysis. SG&A and R&D Expenses This was in the eyes of many the second most critical valuation component behind that of volume sales. If SG&A and R&D expenses both only grew at 2% per annum, reflecting what many analysts believed to be the company's cost discipline and strategy moving forward, Ferrari's operating margin would indeed grow considerably over the 10-year forecast period. Depreciation and Capex In its prospectus, Ferrari noted that there would be little additional investment in plant and nt necessary for expanding volume production in the coming years. The company considered itself inherently agile, production increases were nominal in size, and sufficient capacity existed
Step by Step Solution
There are 3 Steps involved in it
Step: 1

Get Instant Access to Expert-Tailored Solutions
See step-by-step solutions with expert insights and AI powered tools for academic success
Step: 2

Step: 3

Ace Your Homework with AI
Get the answers you need in no time with our AI-driven, step-by-step assistance
Get Started


