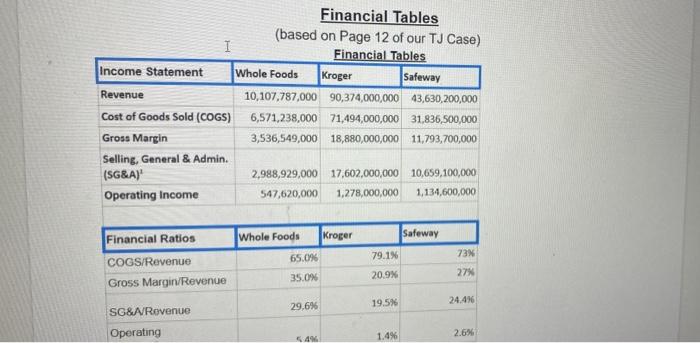
You're a consultant for the grocery industry. You need to get a report on the competitive landscape of brick-and-mortar grocery stores to your client's CEO ASAP. In less than 1 page, 1.15 or 2.0 spacing, 12-point font, answer the following two questions: 1) Using the financial ratios below (2nd table), and Ghemawat and Rivkin's (G&R) ideas on differentiation and cost based competition (use the G&R article for "Creating Competitive Advantage" article) please describe what the ratios tell you about the basic strategies of Whole Foods, Safeway and Kroger. Where do you see evidence for cost or differentiation strategies? You'll see that they differ and that they correspond to the real-world strategies of these firms. Financial Tables (based on Page 12 of our TJ Case) I Financial Tables Income Statement Whole Foods Kroger Safeway Revenue 10,107,787,000 90,374,000,000 43,630,200,000 Cost of Goods Sold (COG) 6,571,238.000 71,494,000,000 31,836,500,000 Gross Margin 3,536,549,000 18,880,000,000 11,793,700,000 Selling, General & Admin. (SG&A) 2,988,929,000 17,602,000,000 10,659,100,000 Operating Income 547,620,000 1,278,000,000 1,134,600,000 Financial Ratios Whole Foods Kroger Safeway 79.1% 73N 65.0% COGS/Revenue Gross Margin/Revenue 20.9% 27% 35.0 24.476 29.6% 19.5% SG&A Revenue Operating 5.4 1.4% 2.6% You're a consultant for the grocery industry. You need to get a report on the competitive landscape of brick-and-mortar grocery stores to your client's CEO ASAP. In less than 1 page, 1.15 or 2.0 spacing, 12-point font, answer the following two questions: 1) Using the financial ratios below (2nd table), and Ghemawat and Rivkin's (G&R) ideas on differentiation and cost based competition (use the G&R article for "Creating Competitive Advantage" article) please describe what the ratios tell you about the basic strategies of Whole Foods, Safeway and Kroger. Where do you see evidence for cost or differentiation strategies? You'll see that they differ and that they correspond to the real-world strategies of these firms. Financial Tables (based on Page 12 of our TJ Case) I Financial Tables Income Statement Whole Foods Kroger Safeway Revenue 10,107,787,000 90,374,000,000 43,630,200,000 Cost of Goods Sold (COG) 6,571,238.000 71,494,000,000 31,836,500,000 Gross Margin 3,536,549,000 18,880,000,000 11,793,700,000 Selling, General & Admin. (SG&A) 2,988,929,000 17,602,000,000 10,659,100,000 Operating Income 547,620,000 1,278,000,000 1,134,600,000 Financial Ratios Whole Foods Kroger Safeway 79.1% 73N 65.0% COGS/Revenue Gross Margin/Revenue 20.9% 27% 35.0 24.476 29.6% 19.5% SG&A Revenue Operating 5.4 1.4% 2.6%


