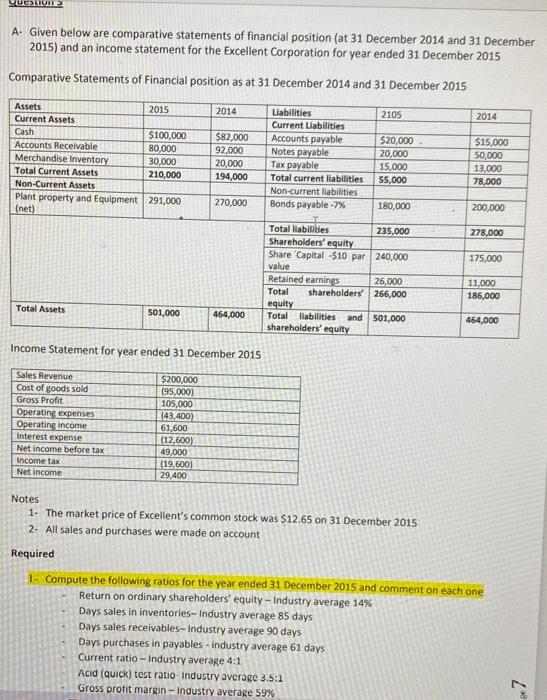
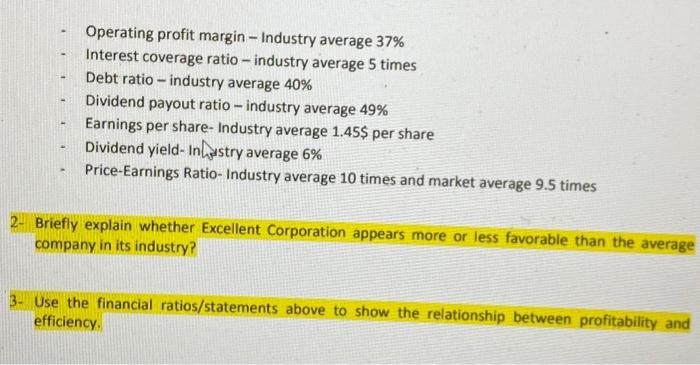
YULUND A- Given below are comparative statements of financial position (at 31 December 2014 and 31 December 2015) and an income statement for the Excellent Corporation for year ended 31 December 2015 Comparative Statements of Financial position as at 31 December 2014 and 31 December 2015 2014 2105 2014 Assets 2015 Current Assets Cash $100,000 Accounts Receivable 80,000 Merchandise Inventory 30,000 Total Current Assets 210,000 Non-Current Assets Plant property and Equipment 291,000 (net) $82,000 92,000 20,000 194,000 Liabilities Current Liabilities Accounts payable Notes payable Tax payable Total current liabilities Non-current liabilities Bonds payable -7% $20,000 20,000 15,000 55,000 $15,000 50,000 13,000 78,000 270,000 180,000 200,000 278,000 175,000 Total liabilities 235,000 Shareholders' equity Share Capital -$10 par 240,000 value Retained earnings 26,000 Total shareholders 266,000 equity Total liabilities and 501,000 shareholders' equity 11,000 186,000 Total Assets 501,000 464,000 464,000 Income Statement for year ended 31 December 2015 Sales Revenue Cost of goods sold Gross Profit Operating expenses Operating income Interest expense Net Income before tax Income tax Net Income $200,000 (95.000) 105,000 (43,400) 61,600 (12,600) 49,000 (19,600) 29.400 Notes 1. The market price of Excellent's common stock was $12.65 on 31 December 2015 2. All sales and purchases were made on account Required 1. Compute the following ratios for the year ended 31 December 2015 and comment on each one Return on ordinary shareholders' equity - Industry average 14% Days sales in inventories- Industry average 85 days Days sales receivables- Industry average 90 days Days purchases in payables - Industry average 61 days Current ratio - Industry average 4:1 Acid (quick) test ratio Industry average 3.5:1 Gross profit margin - Industry average 59% Operating profit margin - Industry average 37% Interest coverage ratio - industry average 5 times Debt ratio - industry average 40% Dividend payout ratio - industry average 49% Earnings per share- Industry average 1.45$ per share Dividend yield-Inhastry average 6% Price-Earnings Ratio- Industry average 10 times and market average 9.5 times 2- Briefly explain whether Excellent Corporation appears more or less favorable than the average company in its industry? 3. Use the financial ratios/statements above to show the relationship between profitability and efficiency YULUND A- Given below are comparative statements of financial position (at 31 December 2014 and 31 December 2015) and an income statement for the Excellent Corporation for year ended 31 December 2015 Comparative Statements of Financial position as at 31 December 2014 and 31 December 2015 2014 2105 2014 Assets 2015 Current Assets Cash $100,000 Accounts Receivable 80,000 Merchandise Inventory 30,000 Total Current Assets 210,000 Non-Current Assets Plant property and Equipment 291,000 (net) $82,000 92,000 20,000 194,000 Liabilities Current Liabilities Accounts payable Notes payable Tax payable Total current liabilities Non-current liabilities Bonds payable -7% $20,000 20,000 15,000 55,000 $15,000 50,000 13,000 78,000 270,000 180,000 200,000 278,000 175,000 Total liabilities 235,000 Shareholders' equity Share Capital -$10 par 240,000 value Retained earnings 26,000 Total shareholders 266,000 equity Total liabilities and 501,000 shareholders' equity 11,000 186,000 Total Assets 501,000 464,000 464,000 Income Statement for year ended 31 December 2015 Sales Revenue Cost of goods sold Gross Profit Operating expenses Operating income Interest expense Net Income before tax Income tax Net Income $200,000 (95.000) 105,000 (43,400) 61,600 (12,600) 49,000 (19,600) 29.400 Notes 1. The market price of Excellent's common stock was $12.65 on 31 December 2015 2. All sales and purchases were made on account Required 1. Compute the following ratios for the year ended 31 December 2015 and comment on each one Return on ordinary shareholders' equity - Industry average 14% Days sales in inventories- Industry average 85 days Days sales receivables- Industry average 90 days Days purchases in payables - Industry average 61 days Current ratio - Industry average 4:1 Acid (quick) test ratio Industry average 3.5:1 Gross profit margin - Industry average 59% Operating profit margin - Industry average 37% Interest coverage ratio - industry average 5 times Debt ratio - industry average 40% Dividend payout ratio - industry average 49% Earnings per share- Industry average 1.45$ per share Dividend yield-Inhastry average 6% Price-Earnings Ratio- Industry average 10 times and market average 9.5 times 2- Briefly explain whether Excellent Corporation appears more or less favorable than the average company in its industry? 3. Use the financial ratios/statements above to show the relationship between profitability and efficiency