Question
Yummy Lunch Restaurant needs to decide the most profitable location for their business expansion. Marketing manager plans to use a multiple regression model to achieve
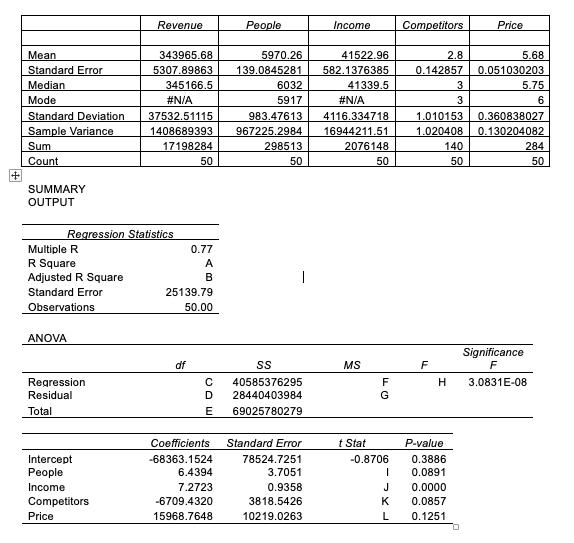
Yummy Lunch Restaurant needs to decide the most profitable location for their business expansion. Marketing manager plans to use a multiple regression model to achieve their target. His model considers yearly revenue as the dependent variable. He found that number of people within 2KM (People), Mean household income(income), no of competitors and price as explanatory variables of company yearly revenue.
The following is the descriptive statistics and regression output from Excel.

a. Complete the missing entries from A to L in this output
b. Derive the regression model
c. What does the standard error of estimate tell you about the model?
d. Assess the independent variables significance at 5% level (develop hypothesis if necessary in the analysis)?
Mean Standard Error Median Mode Standard Deviation Sample Variance Sum Count SUMMARY OUTPUT Multiple R R Square Adjusted R Square Standard Error Observations ANOVA Regression Residual Total Revenue Regression Statistics Intercept People Income Competitors Price 343965.68 5307.89863 345166.5 #N/A 37532.51115 983.47613 1408689393 967225.2984 17198284 298513 50 50 df 0.77 A B 25139.79 50.00 CD E People 6.4394 7.2723 5970.26 139.0845281 -6709.4320 15968.7648 6032 5917 | Coefficients Standard Error -68363.1524 SS 40585376295 28440403984 69025780279 78524.7251 3.7051 0.9358 3818.5426 10219.0263 Income 41522.96 582.1376385 41339.5 #N/A 4116.334718 16944211.51 2076148 50 MS t Stat FL ( G -0.8706 Competitors I 2.8 0.142857 F P-value 0.3886 0.0891 J 0.0000 K 0.0857 L 0.1251 3 3 140 50 H Price 1.010153 0.360838027 1.020408 0.130204082 5.68 0.051030203 5.75 6 284 50 Significance F 3.0831E-08
Step by Step Solution
There are 3 Steps involved in it
Step: 1
a To complete the missing entries A to L in the regression output table we will use the given information and standard formulas applied in regression ...
Get Instant Access to Expert-Tailored Solutions
See step-by-step solutions with expert insights and AI powered tools for academic success
Step: 2

Step: 3

Ace Your Homework with AI
Get the answers you need in no time with our AI-driven, step-by-step assistance
Get Started


