

PRESS statistics for two different models for the gasoline mileage data were calculated in Problems 11.6 and
Question:
PRESS statistics for two different models for the gasoline mileage data were calculated in Problems 11.6 and 11.7. On the basis of the PRESS statistics, which model do you think is the best predictor?
Data From Problem 11.6
In Problem 3.5 a regression model was developed for the gasoline mileage data using the regressor engine displacement x1 and number of carburetor barrels x6. Calculate the PRESS statistic for this model. What conclusions can you draw about the model's likely predictive performance?
Data From Problem 3.5
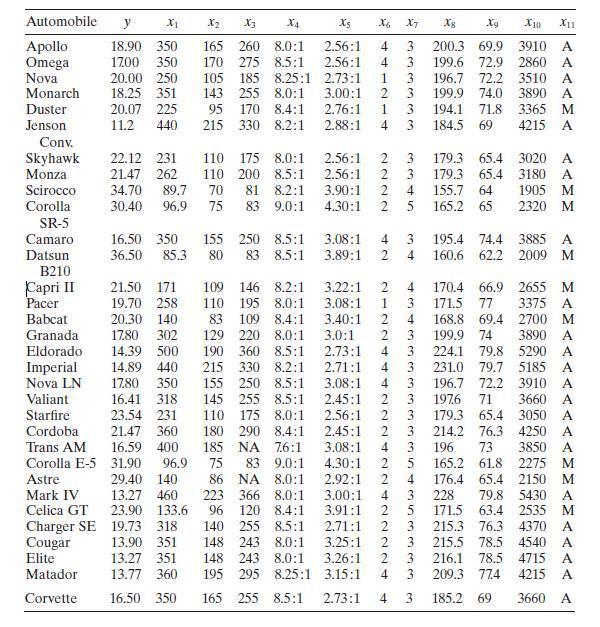
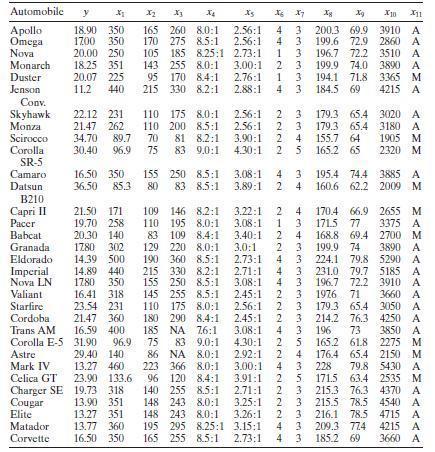
Consider the gasoline mileage data in Table B.3.
Data From Problem 11.7
In Problem 3.6 a regression model was developed for the gasoline mileage data using the regressor vehicle length x8 and vehicle weight x10. Calculate the PRESS statistic for this model. What conclusions can you draw about the potential performance of this model as a predictor?
Data From Problem 3.6
In Problem 2.4 you were asked to compute a 95 CI on mean gasoline prediction interval on mileage when the engine displacement x1=275 in. 3 Compare the lengths of these intervals to the lengths of the confidence and prediction intervals from Problem 3.5 above. Does this tell you anything about the benefits of adding x6 to the model?
Data From Problem 2.4
Table B. 3 presents data on the gasoline mileage performance of 32 different automobiles.
Step by Step Answer:

This question has not been answered yet.
You can Ask your question!


Introduction To Linear Regression Analysis
ISBN: 9781119578727
6th Edition
Authors: Douglas C. Montgomery, Elizabeth A. Peck, G. Geoffrey Vining
