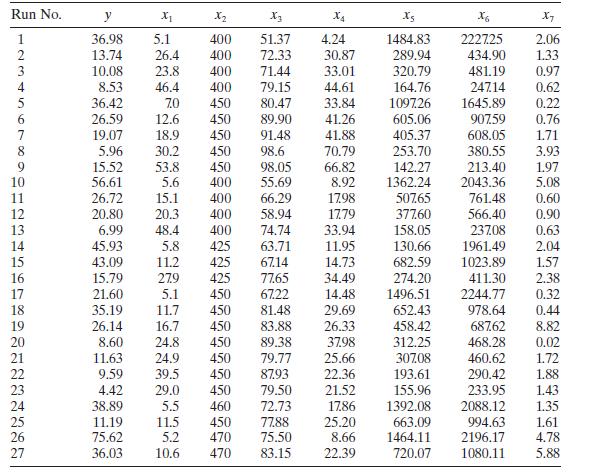
The data in Table B. 5 present the performance of a chemical process as a function of
Question:
The data in Table B. 5 present the performance of a chemical process as a function of several controllable process variables.

a. Fit a multiple regression model relating $\mathrm{CO}_{2}$ product $(y)$ to total solvent $\left(x_{6}\right)$ and hydrogen consumption $\left(x_{7}\right)$.b. Test for significance of regression. Calculate $R^{2}$ and $R_{\text {Adj }}^{2}$.
c. Using $t$ tests determine the contribution of $x_{6}$ and $x_{7}$ to the model.
d. Construct $95 %$ CIs on $\beta_{6}$ and $\beta_{7}$.
e. Refit the model using only $x_{6}$ as the regressor. Test for significance of regression and calculate $R^{2}$ and $R_{\text {Adj. }}^{2}$. Discuss your findings. Based on these statistics, are you satisfied with this model?
f. Construct a $95 %$ CI on $\beta_{6}$ using the model you fit in part e. Compare the length of this CI to the length of the CI in part d. Does this tell you anything important about the contribution of $x_{7}$ to the model?
g. Compare the values of $M S_{\text {Res }}$ obtained for the two models you have fit (parts a and e). How did the $M S_{\text {Res }}$ change when you removed $x_{7}$ from the model? Does this tell you anything importaut about the contributiou of $x_{7}$ to the model?
Step by Step Answer:

Introduction To Linear Regression Analysis
ISBN: 9781119578727
6th Edition
Authors: Douglas C. Montgomery, Elizabeth A. Peck, G. Geoffrey Vining


