

Question: In a study, a researcher measures the preference of men and women for two brands of frozen pizza (one low-fat and one regular) based on
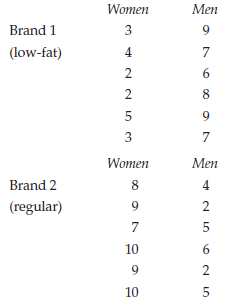
In a study, a researcher measures the preference of men and women for two brands of frozen pizza (one low-fat and one regular) based on the number of 1-inch pieces of each type of pizza eaten when both types are available to the participants. The following table shows the number of pieces of each type of pizza eaten for each of the 24 subjects in the study.
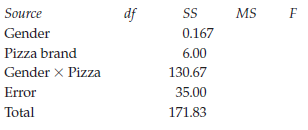
a. Complete the ANOVA summary table. (If your instructor wants you to calculate the sums of squares, use the preceding data to do so.)
b. Are the values of Fobt significant at α = .05? At α = .01?
c. What conclusions can be drawn from the F-ratios?
d. What is the effect size, and what does this mean?
e. Graph the means.
Women Men Brand 1 3 (low-fat) 4. 2 2 5 3 Women Men Brand 2 4 (regular) 9. 10 6. 10 Source df MS Gender 0.167 Pizza brand 6.00 Gender x Pizza 130.67 Error 35.00 Total 171.83
Step by Step Solution
3.47 Rating (154 Votes )
There are 3 Steps involved in it
a Source df SS MS F Gender 1 0167 0167 0095 Pizza Brand 1 600 600 343 Gender x Pizza 1 13067 13067 7... View full answer

Get step-by-step solutions from verified subject matter experts