

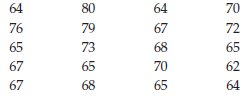
Question: Which type of figure should be used to represent the data in Exercise 1a bar graph, histogram, or frequency polygon? Why? Draw the appropriate figure
Which type of figure should be used to represent the data in Exercise 1€”a bar graph, histogram, or frequency polygon? Why? Draw the appropriate figure for these data.
s8
Step by Step Solution
★★★★★
3.32 Rating (164 Votes )
There are 3 Steps involved in it
1 Expert Approved Answer
Step: 1 Unlock

Either a histogram or a frequency polygon could ... View full answer
Question Has Been Solved by an Expert!
Get step-by-step solutions from verified subject matter experts
Step: 2 Unlock
Step: 3 Unlock