COST PER HIRE is an important budgeting statistic for organizations so that it can be managed before
Question:
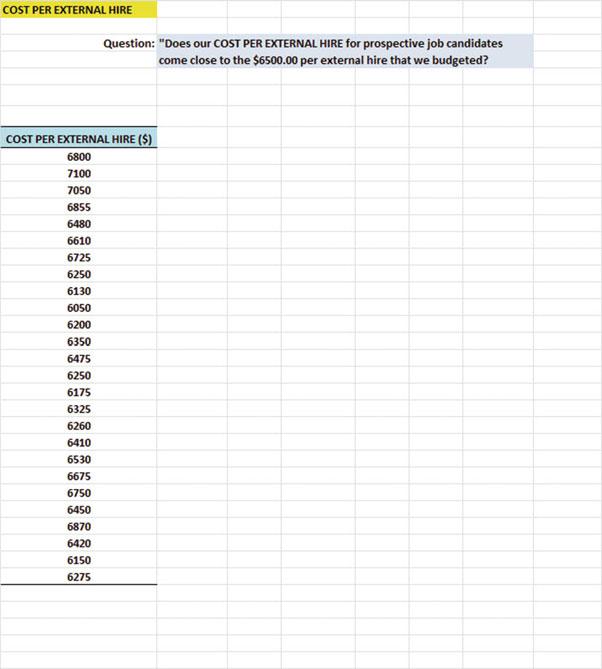
COST PER HIRE is an important budgeting statistic for organizations so that it can be managed before it becomes too high a cost for the organization to bear. If a financial officer wants to find out the cost per hire, the financial officer could select a random sample of new-hires during the past year and use it to estimate the true cost of hiring new workers. It is also important for the organization to determine the COST PER HIRE for both applicants hired from outside of the organization, and applicants hired for a new job who were already working for the organization. For this example, let’s focus on determining the COST PER EXTERNAL HIRE that would include external advertising costs, external travel costs, external referral bonuses paid, external relocation costs, external recruiter costs, as well as other costs specified by the organization. Let’s suppose that the organization has budgeted that the average COST PER EXTERNAL HIRE would be $6,500.00. Let’s suppose that you have taken a small random sample of external hires to test your Excel skills, and that you want to analyze the hypothetical data in Fig. 3.9.
Create an Excel spreadsheet with these data.
(a) Use Excel to the right of the table to find the sample size, mean, standard deviation, and standard error of the mean for these data. Label your answers, and use currency format (zero decimal places) for the mean, standard deviation, and standard error of the mean
(b) Enter the null hypothesis and the research hypothesis for this item on your spreadsheet.
(c) Use Excel’s TINV function to find the 95 % confidence interval about the mean for these data. Label your answers on your spreadsheet. Use currency format (zero decimal places) for the lower limit and the upper limit of the confidence interval.
(d) Enter the result of the test on your spreadsheet.
(e) Enter the conclusion of the test in plain English on your spreadsheet.
(f) Print your final spreadsheet so that it fits onto one page (if you need help remembering how to do this, see the objectives at the end of Chap. 2 in Sect. 2.4).
(g) Draw a picture of the confidence interval, including the reference value, onto your spreadsheet.
(h) Save the final spreadsheet as: EXTERNAL3
Step by Step Answer:

Excel 2013 For Human Resource Management Statistics A Guide To Solving Practical Problems
ISBN: 97173
2nd Edition
Authors: Thomas J. Quirk, Julie Palmer Schuyler


